Washington State Ferries - Reliability
On this page:
Reliability percentages
Source: Washington State Ferries
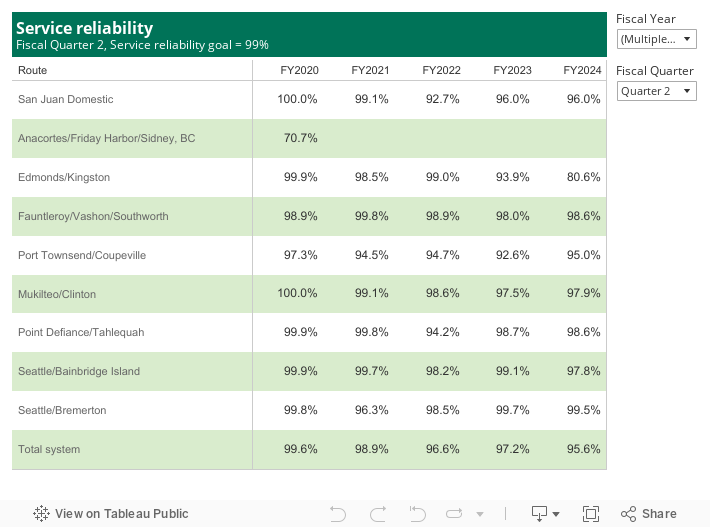
Notes: Fiscal year - July 1 through June 30. The Anacortes-Friday Harbor-Sidney, B.C. route has been closed since the beginning of the COVID-19 pandemic. WSF combines the Anacortes-Friday Harbor route with the San Juan Interisland route as the San Juan Islands Domestic for on-time service reliability as available data does not distinguish between these two routes.
Performance analysis
FY2025 Q1 (July - September 2024)
WSF service reliability unchanged compared to same quarter last year
In the first quarter of fiscal year 2025, Washington State Ferries scheduled 37,193 ferry trips and completed 36,128 (97.1%). This was a decrease of 0.1 percentage point compared to the same quarter in FY2024 and missed the annual service reliability goal of 99%. The number of scheduled trips for the first quarter of FY2025 was 168 (0.5%) more than the 37,025 scheduled in the same quarter of FY2024.
WSF continues to operate under an alternate service plan since the pandemic to balance service demand with available crew and vessel resources. In June 2024, WSF introduced an unscheduled third ferry on the Fauntleroy-Vashon-Southworth route on weekdays, operating when crew and a vessel are available. This "bonus boat" service has since been expanded to operate seven days a week, when a vessel is available. WSF remains focused on customers' needs, workforce (crew) capacity, vessel availability, and service levels to identify opportunities to restore pre-pandemic service across all routes.
FY2024 Q4 (April - June 2024)
WSF service reliability improves compared to same quarter last year
Washington State Ferries scheduled 36,340 ferry trips during the fourth quarter of FY2024 and completed 35,848 (98.6%). This missed the annual service reliability performance goal of 99% but was a slight improvement over the fourth quarter of FY2023, when WSF completed 98.2% of scheduled trips. The total number of trips scheduled for the fourth quarter of FY2024 was 118 (0.3%) fewer than the 36,458 scheduled during the same quarter in FY2023.
WSF continues to operate under an alternate service plan to balance service demand with available crewing resources and vessel availability. In June 2024 WSF began operating an unscheduled third ferry on the Fauntleroy-Vashon-Southworth route on weekdays when crewing and a vessel are available. WSF continues to review service needs, workforce (crew) capacity, vessel availability, and service levels for opportunities to restore service to the remaining routes with reduced service.
FY2024 Q3 (Janary - March 2024)
WSF service reliability improves over previous year to 99.0%
There were 35,535 regularly scheduled ferry trips during the third quarter of fiscal year 2024, 0.9% (311) more than the same quarter of FY2023 (35,224). WSF completed 99.0% (35,181) of these scheduled trips in the third quarter of FY2024, a 1.3 percentage point increase compared to the same quarter in FY2023 (97.7%). This met the annual service reliability performance goal of 99% for the first time since 2020. Service reliability is defined as the percentage of scheduled trips that were completed within a defined time frame.
WSF continues to operate under an alternate service plan to balance service demand with available crewing resources and vessel availability. A year ago, early in the third quarter of FY2023, WSF was operating only one vessel on the Edmonds-Kingston route. This route was restored to two-boat service in February 2023. However, three other routes continue under reduced service: Seattle-Bremerton (one vessel instead of two), Fauntleroy-Vashon-Southworth (two vessels instead of three), and Port Townsend-Coupeville (one vessel year-round instead of two from late spring through early fall).
FY2024 Q2 (October - December 2023)
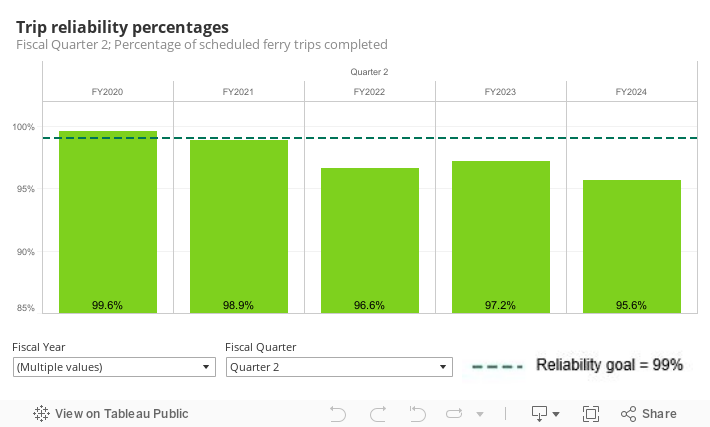
WSF service reliability decreases to 95.6%
WSF completed 95.6% (35,043 trips) of 36,644 scheduled trips compared to 97.2% (33,938 trips) of 34,922 scheduled trips in the same quarter the previous year. Quarterly performance missed the annual service reliability performance goal (99%) by 3.4 percentage points.
WSF is currently operating under a Service Contingency Plan. This plan has a baseline of 15 vessels in service, with up to 17 available for portions of the year. The agency is projected to stay on this plan for the next four years due to labor shortages and vessel constraints. Prior to the pandemic, WSF operated 17 vessels during the second quarter of the year; the difference is there is one less boat on the Seattle/Bremerton route, and one less boat on the Fauntleroy/Vashon/Southworth routes than there was in 2019.
FY2024 Q1 (July - September 2023)
WSF service reliability decreases to 97.2%
There were 37,025 ferry trips scheduled during the first quarter of fiscal year 2024 (July through September 2023). Washington State Ferries completed 97.2% (36,005) of these trips. This missed the annual service reliability goal of 99%, and was a decrease of 0.4 percentage points compared to the same quarter in FY2023.
In the first quarter of FY2024, WSF continued to operate the Alternate Service Plan put in place in October 2022 with 15 vessels running system wide. Before the pandemic, WSF ran between 18 and 19 ferries during July - September.
FY2023 Q4 (April - June 2023)
WSF service reliability remains steady compared to same quarter last year
Washington State Ferries scheduled 36,458 ferry trips during the fourth quarter of FY2023 and completed 35,812 (98.2%). This missed the annual service reliability performance goal of 99% but was the same as the fourth quarter in FY2022. The total trips scheduled for the fourth quarter of FY2023 was 2,533 (7.5%) more than the 33,925 scheduled during the same quarter in FY2022. The increase was due to WSF adding a second regularly scheduled vessel to the Mukilteo/Clinton Route in May 2022 and the Edmonds/Kingston Route in February 2023 under the Service Restoration Plan (SRP).
WSF was authorized to operate as many as 19 vessels during the fourth quarter; however, due to the SRP no more than 15 vessels operated. WSF continues to review service needs, workforce (crew) capacity, vessel availability, and service levels for opportunities to restore service to the remaining routes with reduced service.
FY2023 Q3 (January - March 2023)
WSF service reliability decreases to 97.7%
There were 35,224 regularly scheduled ferry trips during the third quarter of fiscal year 2023, 24.4% (6,918) more than the same quarter of FY2022 (28,306). WSF completed 97.7% (34,402) of these scheduled trips in the third quarter of FY2023, a 1.1 percentage point decrease compared to the same quarter in FY2022 (98.8%). This missed the annual service reliability performance goal of 99% by 1.3 percentage points.
WSF continues to operate under an alternate service plan to balance service demand with available crewing resources and vessel availability. A year ago, in the third quarter of FY2022, WSF was operating only one vessel on the Mukilteo/Clinton, Edmonds/Kingston, and Seattle/Bainbridge routes. These routes were restored to two-boat service in FY2023.
FY2023 Q2 (October - December 2022)
WSF service reliability improves to 97.2%
WSF continued to operate on an alternate service plan with reduced service and a maximum of 15 vessels during the second quarter of fiscal year 2023 (October through December 2022).
There were 34,922 regularly scheduled ferry trips for the quarter, compared to 30,277 in the same quarter of FY2022. WSF completed 97.2% (33,938) of these trips compared to 96.6% (29,261) in the previous year. Quarterly performance missed the annual service reliability performance goal of 99% by 1.8%.
FY2023 Q1 (July - September 2022)
WSF service reliability decreases to 97.6%
There were 35,050 ferry trips scheduled during the first quarter of fiscal year 2023 (July through September 2022). Washington State Ferries completed 97.6% (34,221) of these trips. This missed the annual service reliability goal of 99%, and was a decrease of 0.9 percentage points compared to the same quarter in FY2022.
In the first quarter of FY2023, WSF continued the alternate service plan put in place in October 2022 with up to 15 vessels running system-wide. In the same quarter of FY2022, WSF operated on a modified schedule with 17 vessels. Before COVID-19, WSF typically ran 18 or 19 vessels during July - September.
FY2022 Q3 (January - March 2022)
WSF service reliability decreases slightly in the fourth quarter of fiscal year 2022
Washington State Ferries scheduled 33,925 ferry trips during the fourth quarter of FY2022 (April through June 2022) and completed 33,328 (98.2%). This missed the annual service reliability performance goal of 99% and was 0.7 percentage points lower than the same quarter in FY2021. The total trips scheduled for the fourth quarter of FY2022 were 3,390 (9.1%) less than the 37,315 scheduled during the same quarter in FY2021 because WSF continued to operate on a reduced service plan.
WSF typically has 19 vessels in service during the fourth quarter; however, due to the plan no more than 15 vessels operated. WSF continues to review service needs, workforce (crew) capacity, vessel availability, and service levels for opportunities to restore additional service.
FY2022 Q3 (January - March 2022)
WSF service reliability improves to 98.8%
There were 28,306 regularly scheduled ferry trips during the third quarter of fiscal year 2022, 21.8% (7,910) fewer than the same quarter of FY2021 (36,216). WSF completed 98.8% (27,955) of these scheduled trips in the third quarter of FY2022, a 0.6% improvement compared to the same quarter in FY2021 (98.2%), but missed the annual service reliability performance goal of 99% by 0.2 percentage points.
FY2022 Q2 (October - December 2021)
WSF service reliability declines to 96.6%
Washington State Ferries reviews service levels based on four criteria (pillars)-ridership demand, crew availability, vessel availability and financial resources-in an ongoing effort to provide the best level of service within these parameters.
Primarily due to crew availability issues, WSF began an alternate service schedule in October 2021. Eleven vessels operated on this schedule each day: one on each route except the Fauntleroy/Vashon/Southworth route (two vessels), and three vessels on the San Juan Domestic route until November 19 when a fourth vessel was added. Trips were added back on the Seattle/ Bainbridge, Edmonds/Kingston and Mukilteo/Clinton routes on a daily basis as staffing levels permitted.
There were 30,277 regularly scheduled ferry trips during the second quarter of FY2022 compared to 36,690 in the same quarter in FY2021. WSF completed 96.6% (29,261) of these trips compared to 98.9% (36,288) in the previous year. Quarterly performance missed the annual service reliability performance goal of 99%.
FY2022 Q1 (July - September 2021)
WSF service reliability improves to 98.5%
Washington State Ferries reviews service levels based on four criteria (pillars)-ridership demand, crew availability, vessel availability and financial resources-in an ongoing effort to provide the best level of service within these parameters.
In the first quarter of FY2022, WSF operated on a modified summer service schedule with 39,467 trips scheduled. In the same quarter of FY2021, WSF operated on a modified (reduced) winter schedule due to the pandemic, and there were 34,792 trips scheduled.
There were 39,467 ferry trips scheduled during the first quarter of fiscal year 2022 (July through September 2021). Washington State Ferries completed 98.5% (38,893) of these trips. This missed the annual service reliability goal of 99%, but was an increase of 1.3 percentage points compared to the same quarter in FY2021.
FY2021 Q4 (April - June 2021)
WSF service reliability declines to 98.9%
Washington State Ferries reviews service levels based on four criteria (pillars)-ridership demand, crew availability, vessel availability and financial resources-in an ongoing effort to provide the best level of service within these parameters.
There were no scheduled trips on the Anacortes/Friday Harbor/Sidney, B.C. route as the international border remains closed due to COVID-19 concerns.
There were 37,315 regularly scheduled ferry trips during the fourth quarter of FY2021 (April through June 2021). Washington State Ferries completed 98.9% (36,901) of these trips. This missed the annual service reliability performance goal of 99% and was 0.3 percentage points lower than the fourth quarter in FY2020.
FY2021 Q3 (Januarly - March 2021)
WSF service reliability declines to 98.2%
Washington State Ferries has been operating on a modified winter schedule since March 2020 due to the COVID-19 pandemic. WSF management is reviewing service levels based on four criteria (pillars)—ridership demand, crew availability, vessel availability and financial resources—in an ongoing effort to provide the level-of-service that can best fit within these parameters.
There were 36,216 regularly scheduled ferry trips during the third quarter of fiscal year 2021—7% fewer than the 38,921 trips in the same quarter of FY2020. WSF completed 98.2% (35,556) of regularly scheduled trips in the third quarter of FY2021, missing the annual service reliability performance goal of 99% by 0.8 percentage points. This was 1.0 percentage point lower than in the same quarter in FY2020.
FY2021 Q2 (October - December 2020)
WSF service reliability declines to 98.9%
There were 36,690 regularly scheduled ferry trips during the second quarter offiscal year 2021 (October through December 2020). Washington State Ferries completed 98.9% (36,288) of these trips. This percentage narrowly missed the annual service reliability performance goal of 99%, and was a decrease of 0.7 percentage points compared to the same quarter in FY2020.
FY2021 Q1 (July - September 2020)
WSF service reliability declines to 97.2%
There were 34,792 regularly scheduled summer ferry trips during the first quarter of FY2021 (July through September 2020). Washington State Ferries completed 97.2% (33,823) of these trips. This percentage missed the annual service reliability performance goal of 99%, and is a decrease of 2.4 percentage points compared to the same quarter in FY2020.