Washington State Ferries - On-time performance
On this page:
On-time performance

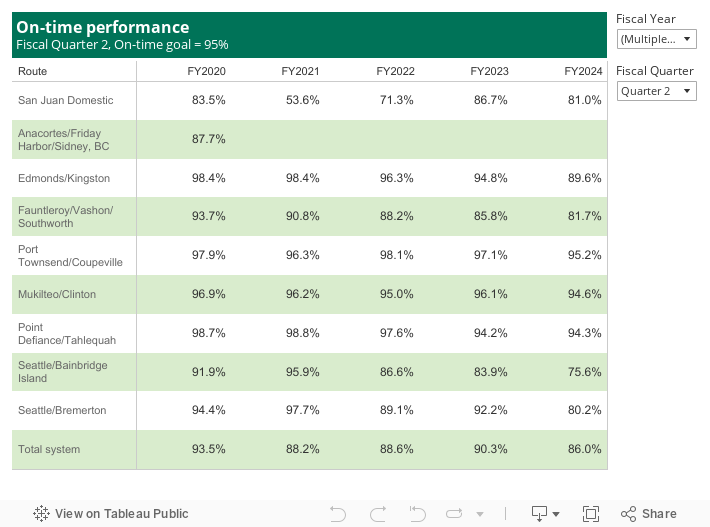
Source: Washington State Ferries
Note: Fiscal year - July 1 through June 30. WSF combines the Anacortes-Friday Harbor route with the San Juan Interisland route as the San Juan Islands Domestic for on-time performance as available data does not distinguish between these two routes. The Anacortes-Friday Harbor-Sidney, B.C. route has been closed since the beginning of the COVID-19 pandemic.
Performance analysis
FY2025 Q2 (October - December 2024)
On-time performance improves during the quarter
On-time performance increased 4.1 percentage points to 90.1% in the second quarter of FY2025 compared to 86.0% for the same quarter in FY2024. The quarterly rate was below WSF's annual on-time performance goal of 95%.
On average, in the second quarter of FY2025, 39 (9.9%) of the 388 daily trips did not leave the terminal within 10 minutes of the scheduled departure time, an improvement from the average of 52 out of 373 trips (14%) for the same quarter in FY2024.
Compared to the second quarter of FY2024, on-time performance increased on all but one route. The Point Defiance-Tahlequah route decreased by 8.5 percentage points, from 94.3% in the second quarter of FY2024 to 85.8% in FY2025. The Seattle-Bremerton route experienced the largest increase (14.8 percentage points) from 80.2% to 95.0%.
FY2025 Q1 (July - September 2024)
WSF on-time performance decreases during the quarter
On-time performance, defined as the percentage of completed sailings that departed within 10 minutes of their scheduled departure time, was 72.0% in the first quarter of FY2025. This was 3.8 percentage points lower than the same quarter in FY2024 and marked the lowest on-time performance for a quarter in a decade. The quarterly rate was below WSF's annual on-time performance goal of 95%. This quarter, which is most of WSF's summer service schedule, typically has lower on-time performance than other quarters, due to the increased ridership from summer travel. This leads to longer loading and unloading times, which slows vessel departure and arrival times.
Three routes had on-time performance under 75%: Fauntleroy-Vashon-Southworth (74.7%), Seattle-Bainbridge Island (58.2%), and Anacortes-San Juan Islands Domestic (48.7%). None of WSF's eight routes met the annual on-time performance goal of 95% this quarter.
The Anacortes-San Juan Islands Domestic route continues to have the lowest on-time performance, with 48.7% of the sailings departing on-time, down 11.9 percentage points from the same quarter last year. This decline was partly due to more trip cancellations. As a result, other vessels on the San Juan Islands Domestic route made additional stops to maintain service to all islands, reducing overall on-time performance for the San Juan Islands Domestic route. After a two year effort, WSF has just released a new schedule for this route aimed at improving on-time performance, supporting reliability, and maintaining capacity. The revised schedule will take effect December 29, 2024.
The Seattle-Bainbridge Island route had 58.2% of sailings depart on-time, a 14.4 percentage point drop from the same quarter last year. This decline was primarily due to the absence of the M/V Wenatchee, which has been out of service for hybrid-electric conversion and other upgrades since last fall. Its substitute, the slower and smaller M/V Chimacum has struggled to maintain the sailing schedule. The M/V Wenatchee is expected to return to service in summer 2025.
The Fauntleroy-Vashon-Southworth route had on-time performance of 74.7%, a 2.0 percentage point improvement compared to the first quarter of FY2024. To further improve performance, WSF has signed a contract with a consultant to rewrite the schedule for this route with aims to have a new schedule in place for the Spring 2025 season.
FY2024 Q4 (April - June 2024)
WSF on-time performance decreases during the quarter
On-time performance was 79.4% in the fourth quarter of FY2024, 2.2 percentage points lower than the same quarter in FY2023. This means 7,186 of the 34,902 total sailings did not leave the dock within 10 minutes of the scheduled time. This quarter's overall on-time performance was the lowest since the first quarter of FY2024 (which was 75.8%) and was the lowest fourth quarter on-time performance in at least 10 years. The quarterly rate missed WSF's annual on-time performance goal of 95%.
The Anacortes-San Juan Island routes continue to have the lowest on-time performance, with 64.1% of the sailings this quarter departing on-time—a slight improvement over the same quarter last year. WSF is currently rewriting the schedule for this route and revising timetables to improve on-time performance, support reliability, and maintain as much capacity as possible. The Seattle-Bainbridge Island route also had low on-time performance this quarter, with 66.8% of sailings departing on-time, its lowest on-time performance of any quarter in at least 10 years. One of WSF's eight routes met the annual goal this quarter, Port Townsend-Coupeville, with 96.7% on-time performance.
FY2024 Q3 (January - March 2024)
On-time performance declines in the third quarter of FY2024
On-time performance was 88.3% in the third quarter of FY2024; this is 1.2 percentage points lower than the same quarter in FY2023 and the lowest on-time performance for the third quarter in more than five years. WSF's quarterly performance was 6.7 percentage points below the annual on-time performance goal of 95%. On-time performance is defined as the percentage of total trips that departed within 10 minutes of the scheduled departure time.
On-time performance increased on four of the eight routes compared to the third quarter of FY2023. Of the 34,635 completed trips, 4,066 (11.7%) trips did not leave the terminal within 10 minutes of the scheduled departure time.
The Seattle-Bremerton route had the largest percentage increase (3.7%) from 91.6% to 95.3% on time.
On-time performance in the third quarter of FY2024 was lowest for the Fauntleroy-Vashon-Southworth (Triangle), Seattle-Bainbridge Island, and Anacortes-San Juan routes, all of which have been facing schedule challenges. On-time performance continues to lag on the Triangle route which is operating on reduced two-vessel service instead of three vessels. On the Seattle-Bainbridge Island route it has been difficult for the vessels currently assigned, including an Olympic-class vessel, to keep to the schedule. The Anacortes-San Juan route has had lower on-time performance than other routes; WSF is in the process of reviewing service schedules in the San Juan Islands with a goal of proposing revised schedules in the next year.
FY2024 Q2 (October - December 2023)
On-time performance worsens during the quarter
On-time performance decreased 4.3 percentage points to 86% in the second quarter of FY2024 compared to 90.3% for the same quarter in FY2023. The quarterly rate was below WSF's annual on-time performance goal of 95%.
On average, in the second quarter of FY2024, 52 (14%) of the 373 daily trips did not leave the terminal within 10 minutes of the scheduled departure time, an increase from the average of 37 out of 378 trips (9.7%) for the same quarter in FY2023.
Compared to the second quarter of FY2023, on-time performance decreased on all but one route. The Point Defiance/Tahlequah route increased by 0.1 percentage point, from 94.2% in the second quarter of FY2023 to 94.3% in FY2024.The Seattle/Bremerton route experienced the largest decrease (12 percentage points) from 92.2% to 80.2%.
FY2024 Q1 (July - September 2023)
WSF on-time performance improves during the quarter
On-time performance was 75.8% in the first quarter of FY2024, 1.2 percentage points higher than the same quarter in FY2023. The quarterly rate was below WSF's annual on-time performance goal of 95%.
On-time performance increased on three of the eight routes compared to the first quarter of FY2023. The largest increase was the San Juan Domestic route, which increased 12.9% in FY2024 as compared to the same quarter in FY2023.
On-time performance for the Edmonds/Kingston and Mukilteo/Clinton routes declined 4.5 and 4.0 percentage points, respectively. Both routes also had a decline in reliability, which means fewer sailings occurred in relation to scheduled sailings. With fewer sailings, vessels are more fully-loaded, which can increase dwell time and adversely affect on-time performance.
FY2023 Q4 (April - June 2023)
WSF on-time performance decreases during the quarter
On-time performance was 81.6% in the fourth quarter of FY2023, 0.2 percentage points lower than the same quarter in FY2022. This means 6,426 of the 34,996 total sailings did not leave the dock within 10 minutes of the scheduled time. The quarterly rate also missed WSF's annual on-time performance goal of 95%.
The Seattle/Bremerton route experienced the largest decrease in on-time performance, going from 96.0% in the fourth quarter of FY2022 to 81.8% in the same quarter of FY2023. The current one-boat service on this route means it is more fully loaded during each sailing, which requires more time to load and unload. This has lowered on-time performance for this route, although more people are able to travel on the route.
FY2023 Q3 (January - March 2023)
WSF misses annual on-time performance goal
On-time performance was 89.5% in the third quarter of FY2023; this is 1.0 percentage point higher than the same quarter in FY2022. WSF's quarterly performance was 5.5 percentage points below the annual on-time performance goal of 95%.
On-time performance increased on two of the eight routes compared to the third quarter of FY2023. Of the 33,584 performed trips, 3,538 (10.5%) trips did not leave the terminal within 10 minutes of the scheduled departure time. The Mukilteo/Clinton route had the largest percentage point increase (7.6%) from 90.7% to 98.3% on time.
FY2023 Q2 (October - December 2022)
On-time performance improves for the quarter
On-time performance increased to 90.3% in the second quarter of FY2023 compared to 88.6% for the same quarter in FY2022. The quarterly rate was below WSF's annual on-time performance goal of 95%.
On average in the second quarter of FY2023, 37 of the 378 (9.7%) daily trips did not leave the terminal within 10 minutes of the scheduled departure time, an improvement from the average of 39 out of 339 trips (11.4%) for the same quarter in FY2022.
On-time performance increased on three routes compared to the second quarter of FY2022. The San Juan domestic route had the largest increase (15.3%), while the Seattle/ Bremerton route increased 3% and the Mukilteo/Clinton route improved by 1.2%.
FY2023 Q1 (July - September 2022)
On-time performance declines during the quarter
On-time performance was 74.6% in the first quarter of FY2023, 7.3 percentage points lower than the same quarter in FY2022. The quarterly rate was below WSF's annual on-time performance goal of 95%.
This was primarily due to the alternate service plan in place for the first quarter of FY2023. There was only one vessel instead of two vessels scheduled on the Seattle/Bremerton, Edmonds/Kingston and Port Townsend/Coupeville routes; the Fauntleroy/Vashon/Southworth route operated on two boats instead of three. A second vessel was operated on the Edmonds/Kingston route with trips added the day of service when there was sufficient crew available. With reduced service, there was more vehicle demand for the vessels that were operating; thus, vessels were more fully loaded, and this resulted in increased dwell time to load and unload vessels which adversely affected on-time performance.
The largest decrease was on the Fauntleroy/Vashon/Southworth route, which dropped 15.1 percentage points to 74.7% in FY2023 as compared to 89.8% in the same quarter of FY2022.
On-time performance increased on two of the eight routes compared to the first quarter of FY2022.
FY2022 Q4 (April - June 2022)
On-time performance decreases during quarter
On-time performance was 81.8% in the fourth quarter of FY2022, 3.4 percentage points lower than the same quarter in FY2021. This means 6,065 sailings did not leave the dock within 10 minutes of the scheduled time. The quarterly rate was below WSF's annual on-time performance goal of 95%. The only route to achieve the annual on-time performance goal for the quarter was Seattle/Bremerton at 96%.
The Edmonds/Kingston route experienced the largest decrease in on-time performance, going from 97.7% in the fourth quarter of FY2021 to 84.1% in the same quarter of FY2022. The current one-boat service on this route means it is more fully loaded during each sailing, which requires more time to load and unload.
FY2022 Q3 (January - March 2022)
WSF misses annual on-time performance goal
On-time performance was 88.5% in the third quarter of FY2022; this is 3.6 percentage points lower than the same quarter in FY2021. WSF's quarterly performance was 6.5 percentage points below the annual on-time performance goal of 95%.
On-time performance decreased on five of the eight routes compared to the third quarter of FY2021. Of the 30,331 performed trips, 3,488 (11.5%) trips did not leave the terminal within 10 minutes of the scheduled departure time. The Mukilteo/Clinton route had the largest percentage decrease (8.0%) from 98.7% to 90.7%. The route with the greatest improvement in on-time performance was the San Juan Domestic route with an improvement of 0.9% as compared to the same quarter in the previous year.
FY2022 Q2 (October - December 2021)
On-time performance up slightly, misses goal
On-time performance increased to 88.6% compared to 88.2% for the same quarter in FY2021. The quarterly rate was below WSF's annual on-time performance goal of 95%. On average, 39 out of 339 (11.4%) daily trips did not leave the terminal within 10 minutes of the scheduled departure time, decreasing from an average of 45 out of 382 trips (11.8%) for the same quarter in FY2021.
On-time performance improved on two routes compared to the second quarter of FY2021, with the San Juan domestic route experiencing the largest increase (17.7%). Some sailings experienced high vehicle ridership with the alternate service schedule. More volume on ferries resulted in longer loading and unloading times, which negatively affected on-time performance.
Construction continued on the terminal at Colman Dock in Seattle, and both routes that use the terminal (Seattle/Bainbridge and Seattle/ Bremerton) had decreased on-time performance compared to the same quarter in FY2021 as a result.
FY2022 Q1 (July - September 2021)
On-time performance improves during the quarter
On-time performance was 81.9% in the first quarter of FY2022, 1.6 percentage points higher than the same quarter in FY2021. The quarterly rate was below WSF's annual on-time performance goal of 95%.
On-time performance increased on two of the eight active routes compared to the first quarter of FY2021 (see chart on p.32). The San Juan Domestic route had the largest increase (24.1%) compared to the same quarter in FY2021. This was primarily due to operating on a modified service schedule in FY2022 with additional terminal dwell time for loading and unloading, as compared to the modified winter schedule this route was operating under in FY2021.
During the first quarters of the last five fiscal years, WSF has missed the annual goal of 95% of all trips completed on-time. On-time performance during the first quarters has steadily decreased for four of the last five years, with the only increase occurring in FY2022.
FY2021 Q4 (April - June 2021)
On-time performance decreases during quarter
On-time performance was 85.2% in the fourth quarter of FY2021, 9.9 percentage points lower than in the same quarter in FY2020. This means 5,357 sailings did not leave the dock within 10 minutes of the scheduled time. The quarterly rate missed WSF's annual on-time performance goal of 95%.
On-time performance decreased on all routes compared to the fourth quarter of FY2020. The Edmonds/ Kingston route had the smallest drop in on-time performance with a 1.4 percentage point decrease from 99.1% to 97.7%. This route and the Mukilteo/Clinton route were the only routes to achieve the annual on-time performance goal of 95%.
The San Juan Domestic route experienced the most significant change in on-time performance compared to the same quarter in FY2020, with a decrease of 17.6 percentage points from 84.1% to 66.5%.
The Seattle/Bainbridge Island route had a decrease of 16.3 percentage points from 92.6% to 76.3% in on-time performance. High ridership as noted in the previous section, translates to more vessels being fully loaded with vehicles, which takes more time to load and unload. Combined with ongoing construction at Colman Dock in Seattle that affects vessel unloading on-time performance declined.
FY2021 Q3 (Januarly - March 2021)
WSF misses on-time performance goal
On-time performance was 92.1% in the third quarter of FY2021, 3.2 percentage points lower than the same quarter in FY2020, and 2.9 percentage points below WSF's annual on-time performance goal of 95%.
On-time performance decreased on seven of the eight routes compared to the third quarter of FY2020. On average, 7.9% (2,742) of the scheduled trips did not leave terminals within 10 minutes of the scheduled departure time. The San Juan Domestic route had 71.0% on-time performance, a decrease of 11.6 percentage points from the same quarter last year (82.6%). Excluding the San Juan domestic route, the system had a 96.4% on-time performance.
The only route with an improvement in on-time performance was the Seattle/Bremerton route, which increased 2.1 percentage points— from 95.7% to 97.8%—compared to the same quarter in FY2020.
FY2021 Q2 (October - December 2020)
On-time performance still down during pandemic
On-time performance decreased to 88.2% during the second quarter of FY2021 compared to 93.5% for the same quarter in FY2020. The quarterly rate was below WSF's annual on-time performance goal of 95%.
The San Juan Domestic route—which had on time performance of 53.6%—pulled down the system-wide average for the quarter, which would have been 95.4% otherwise. On-time performance decreased on four of nine routes compared to the second quarter of FY2020. The San Juan domestic route had the largest decrease (-29.9%) in on-time performance compared to the same quarter last year.
WSF continued to operate on a modified winter schedule, which provides less dwell time for vessel loading and unloading. Some routes, including the domestic San Juan route, are experiencing higher ridership than what they have historically experienced during a normal winter schedule. These higher volumes on some routes resulted in longer loading and unloading times and adversely affected on-time performance.
The Seattle/Bainbridge route showed a 4.0 percentage point improvement in on-time performance compared to the same quarter last year . Even though construction continued on the terminal at Colman Dock in Seattle, both routes that use the terminal (Seattle/Bainbridge and Seattle/Bremerton) had improved on-time performance over the same quarter last year.
On average in the second quarter of FY2021, 45 out of 382 (11.8%) daily trips did not leave the terminal within 10 minutes of the scheduled departure time, increasing from an average of 28 out of 435 trips (6.5%) for the same quarter in FY2020.
FY2021 Q1 (July - September 2020)
On-time performance down during COVID-19 pandemic
On-time performance was 80.3% in the first quarter of FY2021, 5.2 percentage points lower than the same quarter in FY2020. The quarterly rate is below WSF's annual on-time performance goal of 95%.
On-time performance increased on five of the eight active routes compared to the first quarter of FY2020.
The San Juan Domestic route had the largest decrease (-33.7%) compared to the same quarter in FY2020. This is primarily due to operating on the modified winter schedule which has shorter terminal dwell times than the normal summer schedule. Fewer sailings resulted in ferries being more fully loaded, which lead to longer dwell times to load and unload. Excluding this route, the system achieved 89.8% on-time performance.
During the first quarters of the last five fiscal years, WSF has missed the annual goal of 95% of all trips completed on-time. On-time performance has steadily decreased from the five-year high of 90.9% in FY2017 to 80.3% in FY2021.