Washington State Ferries - Ridership & Revenue
On this page:
Ridership & Revenue
Source: Washington State Ferries
Note: Fiscal year - July 1 through June 30.
Performance analysis
FY2025 Q2 (October - December 2024)
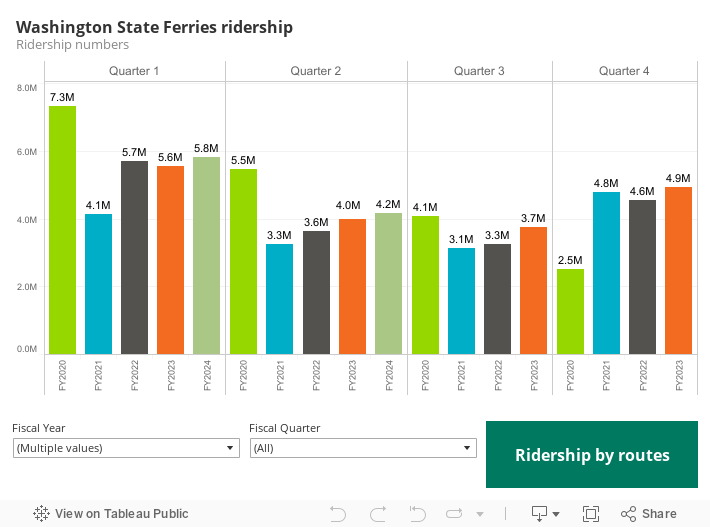
Ridership increases during the second quarter of FY2025
Washington State Ferries' ridership was approximately 4.35 million during the second quarter of FY2025. This was 181,905 (4.4%) more than the same quarter in FY2024, but 64,453 (1.5%) below projections. All but three routes had an increase in ridership, with the highest increase (21.4%) on the Edmonds-Kingston route. The Seattle-Bainbridge, Anacortes-San Juan Islands and Port Townsend-Coupeville routes had reduced ridership; the 3.6% (5,303) decrease on the Port Townsend-Coupeville route was primarily due to more weather-related cancellations in FY2025.
Revenue up this quarter
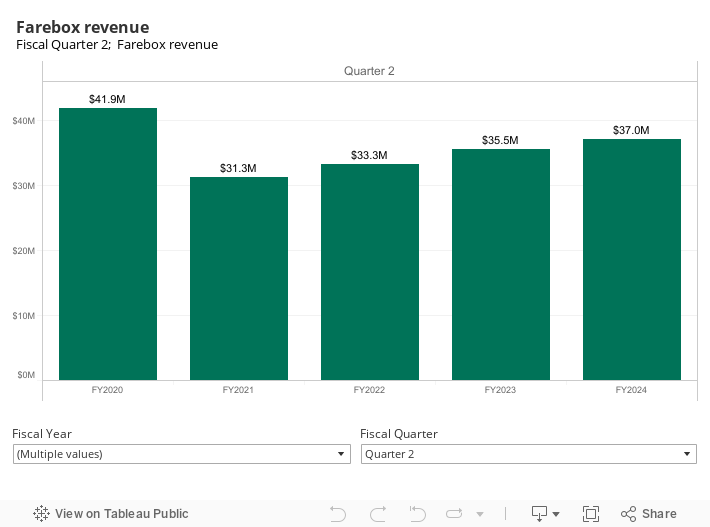
WSF farebox revenue was $40.3 million for the second quarter of FY2025—approximately $3.3 million (8.9%) more than the same quarter in FY2024 ($37.0 million)—but was about $1.55 million (3.7%) below projections for the quarter.
FY2025 Q1 (July - September 2024)
Ridership increases 1.8% during the first quarter of FY2025
In the first quarter of FY2025, WSF saw 5,920,764 boardings, 1.8% more than the same quarter in FY2024 (5,813,459). However, this was 2.6% lower than the ridership projection for the quarter (6,076,110).
Six of WSF's eight routes had more riders compared to the same quarter last year; the exceptions were Mukilteo-Clinton (down 1.9%) and Anacortes-San Juan Islands Domestic (down 2.5% compared to the same quarter last year). The routes with the largest percentage increase in ridership in the first quarter of FY2025 versus the same quarter last year were Tahlequah-Point Defiance (up 7.1%) and Seattle-Bainbridge Island (up 5.0%).
WSF farebox revenue increases
Farebox revenue in the first quarter of FY2025 was approximately $58.6 million, an increase of about $2.7 million compared to the same quarter in FY2024 ($55.9 million). However, this was 1.4% ($820,000) lower than the projected revenue of $59.5 million for the quarter. As revenue and ridership are closely linked, the underperformance can be attributed to lower-than-expected ridership for the quarter.
FY2024 Q4 (April - June 2024)
Ridership increases 1.9% during the fourth quarter of FY2024
There were 5,029,118 boardings during the fourth quarter of FY2024, 1.9% (95,293) more than the same quarter of last year (4,933,825).
Six of WSF's eight routes had more riders compared to the same quarter last year; the exceptions were Edmonds-Kingston (down 2.7%) and Mukilteo-Clinton (down 0.4% compared to last year). The Seattle-Bainbridge route had the largest increase (73,288) with 1,298,400 boardings in the final quarter of FY2024, a 6.0% increase from 1,225,112 in the same quarter last year. The Seattle-Bainbridge route saw particular increases in vehicle and walk-on passengers, up 8.1% and 8.9%, respectively, compared to the same quarter last year.
WSF farebox revenue increases
Farebox revenue for the fourth quarter of FY2024 was approximately $50.1 million, $1.7 million more than the revenues collected in the same quarter of FY2023. However, revenue was $4.9 million (8.9%) below the forecasted amount of $55 million. The annual revenue of $178.6 million was $19.1 million (9.7%) under the forecast for FY2024. The uptick in ridership continues to contribute to the rise in farebox revenue. The elimination of fares from passengers 18 and younger during FY2024, as directed by the state's Move Ahead Washington transportation package, partially accounted for not meeting the fare projection.
FY2024 Q3 (January - March 2024)
Ridership increases in the third quarter of FY2024
Approximately 3.8 million people traveled on WSF's ferries in the third quarter of FY2024. This was about 102,000 (2.7%) more passengers than the corresponding quarter in FY2023 and 7.2% fewer riders than the projected ridership of 4.15 million. The Seattle-Bainbridge Island route had the highest volume of passengers at 980,910. The Edmonds-Kingston route experienced the largest increase in ridership (44,928 riders, or 6.5%) compared to the third quarter of FY2023.
Revenue follows ridership, trends up for the quarter
Farebox revenue was just over $35.5 million for the third quarter of FY2024. This was $1.26 million (3.7%) more than the same period in FY2023 but was nearly $3.2 million (8.2%) less than the $38.8 million projection.
FY2024 Q2 (October - December 2023)
Ridership increases during the second quarter of FY2024
Washington State Ferries' ridership was approximately 4.2 million during the second quarter of FY2024. This was 167,507 (4.2%) more than the same quarter in FY2023, but 380,008 (8.4%) below projections. All but two routes had an increase in ridership, with the highest increase (9.2%) on the Point Defiance/Tahlequah route. Seattle/Bremerton and Edmonds/Kingston routes had less ridership; the 1.2% (8,568) decrease on the Edmonds/Kingston route was primarily due to the route operating with only one vessel for over a month in FY2024.
Revenue up this quarter
WSF farebox revenue was $37 million for the second quarter of FY2024—approximately $1.6 million (4.4%) more than the same quarter in FY2023 ($35.5 million) but was about $4.7 million (11.2%) below projections for the quarter.
FY2024 Q1 (July - September 2023)
Ridership increases 1.8% during the first quarter of FY2024
WSF ridership was approximately 5.8 million in the first quarter of FY2024, 4.5% higher than the same quarter in FY2023 (5.6 million). In the first quarter of FY2024, ridership increased on six routes: Edmonds/Kingston (16.9%), Fauntleroy/Vashon/Southworth (6.9%), Tahlequah/Point Defiance (3.9%), Mukilteo/Clinton (3.2%), Port Townsend/Coupeville (2.8%), and Seattle/Bainbridge Island (0.9%). The increase on the Edmonds/Kingston route was because in FY2023 one vessel operated on this route but in FY2024, two vessels were in service. The route with the biggest decrease was Seattle/Bremerton at 5.0% less ridership in FY2024 than in FY2023.
WSF farebox revenue increases
The revenue in the first quarter of FY2024 ($55.9 million) was approximately $768,000 more than the same quarter in FY2023 ($55.2 million); this was 10.1% lower than the projection of $62.2 million for the quarter. As revenue and ridership are linked, the underperformance was due to less than expected ridership for the quarter.
FY2023 Q4 (April - June 2023)
Ridership increases 8.4% during the fourth quarter of FY2023
There were 4,933,825 boardings during the fourth quarter of FY2023, 8.4% (383,808) more than the same quarter of last year (4,550,017).
Seven of eight routes had more riders compared to the same quarter last year except the Seattle/Bremerton route, which decreased by 11,752 riders (4.5%). This route remains on one-boat service. The Edmonds/Kingston route had the largest increase with 978,062 boardings in the final quarter of FY2023, a 23.5% (185,854) increase from 792,208 in the same quarter last year. The Edmonds/Kingston routes operated one-boat service in the fourth quarter of FY2022, but in the fourth quarter of FY2023 the route was restored to two-boat service.
WSF farebox revenue increases
Farebox revenue for the fourth quarter of FY2023 was approximately $48.5 million, nearly $2.5 million more than the revenues collected in the same quarter of FY2022. However, revenue was $4.5 million (8.5%) below the forecasted amount of $53 million. The annual revenue of $173.4 million was $12.4 million (6.7%) under the forecast for FY2023. The uptick in ridership continues to contribute to the rise in farebox revenue. The elimination of fares from passengers 18 and younger during FY2023 partially accounted for not meeting the fare projection.
FY2023 Q3 (January - March 2023)
Ridership increases in the third quarter of FY2023
WSF ridership was approximately 3.75 million in the third quarter of FY2023. This was about 483,000 (14.8%) more passengers than the corresponding quarter in FY2022 and 7.0% fewer riders than the projected ridership of 4.03 million. This increase in ridership is primarily due to restoring service as available crewing levels increased. The Seattle/Bainbridge Island route had the highest volume of passengers at 970,156 and also experienced the largest increase in ridership (177,000 riders, or 22.4%) compared to the third quarter of FY2022.
Revenue follows ridership, trends up in third quarter of FY2023
Farebox revenue was just over $34 million for the third quarter of FY2023. This was $3.35 million (10.8%) more than the same period in FY2022, however, it was nearly $1 million (2.8%) under the $35.3 million projection. The increase in revenue was due to restored two-boat service on the Seattle/Bainbridge, Clinton/Mukilteo and Edmonds/Kingston routes.
FY2023 Q2 (October - December 2022)
Ridership increases in the second quarter of FY2023
Washington State Ferries' ridership was approximately 4.0 million during the second quarter of FY2023. This the same quarter in FY2022, but 295,684 (6.9%) below projections. All the routes but the Fauntleroy/Vashon/Southworth route had increased ridership with the highest increase (21.9%) occurring on the Seattle/Bainbridge route which operated on one-boat service in FY2022 and two-boat service in FY2023. WSF continues its efforts to restore full service levels to routes as crewing levels allow.
Ridership in the second quarter of FY2023 was 1.5 million (27%) lower than the same quarter of FY2020 (5 million) before the COVID-19 pandemic.
Farebox revenue up in second quarter of FY2023
WSF farebox revenue was $35.5 million for the second quarter of FY2023. This was about $2.2 million (6.6%) more than the same quarter in FY2022 ($33.3 million), but was about $1.94 million (5.2%) below projections for the quarter.
Revenue in the second quarter of FY2023 was $6.4 million (18%) less then the same quarter in FY2020 ($41.9 million) before the COVID-19 pandemic.
FY2023 Q1 (July - September 2022)
Ridership decreases during the first quarter of FY2023
WSF ridership was approximately 5.6 million in the first quarter of FY2023, 3% lower than the same quarter in FY2022 (5.7 million).
Five out of nine routes had lower ridership in the first quarter of 2023. Seattle/Bremerton had the largest decrease with 13.4% less ridership in the first quarter of FY2023 than in the same quarter of FY2022. This route operated with only one vessel this year instead of two. In the first quarter of FY2023, ridership increased on three routes: Seattle/ Bainbridge Island (11.2%), Port Townsend/Coupeville (2.5%), and Tahlequah/Point Defiance (0.9%).
Ridership in the first quarter of FY2023 was 8.0% (481,490) lower than projected; forecast models and modeling are under review to better accommodate changes in travel habits due to COVID-19.
Revenue down this quarter
The revenue in the first quarter of FY2023 ($55.2 million) was approximately $1.9 million less than the same quarter in FY2022 ($57.1 million); it was 8.3% lower than the projection of $60.1 million for the quarter. This was related to lower ridership than projected for the first quarter of FY2023.
FY2022 Q4 (April - June 2022)
Ridership decreases 5.2% during the quarter
There were 4,550,017 boardings during the fourth quarter of FY2022, 5.2% (249,455) fewer than the same quarter of last year (4,799,472). The Edmonds/Kingston route experienced 214,028 (21.3%) fewer riders. There were two boats operating on this route in FY2021, and only one boat most days in the fourth quarter of FY2022. Under the service restoration plan, the Edmonds/Kingston route is scheduled for one boat each day with a second vessel going into service for all or part of the day as crewing allows. WSF is conducting public outreach and offering training opportunities to improve crew levels and restore full service to all routes.
The Seattle/Bainbridge Island route had 1,177,791 boardings in the final quarter of FY2022, an 18.8% increase from 991,661 in the same quarter last year; this was the only route to experience an increase in ridership. With the Bremerton/ Seattle and Edmonds/Kingston routes operating one-boat service during the quarter, more riders opted to use Bainbridge Island/Seattle route, which operates two vessels.
WSF farebox revenue decreases in fourth quarter
Farebox revenue for the fourth quarter of FY2022 was approximately $46 million, approximately $8 million below the forecasted amount of $54 million, and $3 million less than the revenues collected in the same quarter of FY2021. The annual revenue of $167 million was $23.9 million (12.5%) under the forecast for FY2022. The forecast was made before the longlasting effects of the pandemic were understood, with the reduction in service not being anticipated at the time of the forecast.
FY2022 Q3 (January - March 2022)
Ridership increases in the third quarter of FY2022
WSF ridership was approximately 3.26 million in the third quarter of FY2022. This was about 125,600 (4%) more passengers than the corresponding quarter in FY2021 and 21.2% fewer riders than the projected ridership of 4.14 million. This reduction in ridership is primarily due to WSF's reduced service schedule that provided fewer sailings. The Seattle/Bainbridge Island route had the highest volume of passengers at approximately 792,000 and also experienced the largest increase in ridership (203,000 riders, or 34.5%) compared to the third quarter of FY2021.
Revenue follows ridership, trends up for the quarter
Farebox revenue was just under $31 million for the third quarter of FY2022. This was $190,000 (0.6%) more than the same period in FY2021, however, it was nearly $6.7 million (17.8%) under the $37.7 million projection. Revenue projections were made in June 2021 when vehicle ridership was returning at a faster rate than walk-on passengers. As of October 2021, fewer vessels were in service, which meant less vehicle capacity, causing a gap between projected and actual revenue for vehicles.
FY2022 Q2 (October - December 2021)
Ridership increases 11.3%, revenues up 6.3%
WSF ridership was approximately 3.62 million, which was 369,144 (11.3%) more than the same quarter in FY2021, but still 751,085 (17.2%) below projections. The Seattle/Bremerton route had the most significant increase in ridership, carrying 42.6% more (856,077) passengers compared to the same quarter in FY2021 (600,419). The San Juan domestic route experienced the largest decrease in ridership, carrying 3.6% (328,486) fewer people compared to the second quarter of FY2021 (340,797).
Farebox revenue up in second quarter of FY2022
WSF farebox revenue was $33.3 million—about $2 million (6.3%) more than the same quarter in FY2021 ($31.3 million). Fare collection was about $6.5 million (16.3%) below projections for the quarter mainly due to fewer sailings.
FY2022 Q1 (July - September 2021)
Ridership increases during the first quarter of FY2022
Ridership fluctuated with the rise and fall of COVID-19 impacts throughout FY2021 and into FY2022. WSF ridership was approximately 5.7 million in the first quarter of FY2022, 38.3% higher than the same quarter in FY2021 (4.1 million) which was a near-historic low. In the first quarter of FY2022, ridership increased on every WSF route. The Seattle/Bremerton and Seattle/Bainbridge Island routes experienced more than twice the ridership in the first quarter of FY2022 than in the same quarter in FY2021. Ridership in FY2022 was 3.7% (219,289) lower than projected.
Revenue up this quarter, but lower than projections
While revenue in the first quarter of FY2022 ($57 million) was approximately $12.4 million higher than the same quarter in FY2021 ($44.6 million), it was 4.4% lower than the projection of $59.7 million for the quarter. This was related to lower ridership than projected for the first quarter of FY2022 as noted above.
FY2021 Q4 (April - June 2021)
Ridership increases 190.5% during the quarter
With 4,799,472 boardings during the fourth quarter of FY2021 WSF experienced ridership that was nearly double that of the same quarter of FY2020 (2,518,923). WSF ridership continues to rebound from the near-historic lows that occurred due to the impacts of the initial stages of COVID-19.
The Seattle/Bainbridge route experienced the largest gain in ridership, with 654,279 (293.9%) more passengers compared to the fourth quarter of FY2020. The San Juan domestic route had the second highest percentage increase, with 324,440 (233.6%) more riders than the same quarter last year.
WSF farebox revenue increases in fourth quarter
Farebox revenue was $49 million for the fourth quarter of FY2021. This was about $330,000 (0.7%) below projections for the quarter.
Annual revenue for the entirety of FY2021 was about $1.1 million (0.7%) under projections, with automobile/driver fares rebounding faster than passenger fares.
FY2021 Q3 (Januarly - March 2021)
Ridership decreases in the third quarter of FY2021
WSF ridership was approximately 3.1 million during the third quarter of FY2021. This was about 943,000 (23.1%) fewer passengers than in the corresponding quarter of FY2020.
Due to the effects of the pandemic, more people are telecommuting, and fewer people are traveling for non-essential purposes. Accordingly, walk-on ridership was down 67.3% compared to the same quarter in FY2020. The number of riders who drove vehicles onto the ferry was 23.1% less than during the third quarter of FY2020. Vehicle passengers decreased by 7.0% compared to the same quarter last year. To reduce the possible spread of the COVID-19 virus, customers are encouraged to remain in their cars, and are required to wear masks.
Revenue follows ridership, trends down for the quarter
Farebox revenue was $30.8 million for the third quarter of FY2021. Farebox revenue was $2.4 million (7.3%) less than in the same quarter in FY2020, and about $2.1 million (6.4%) less than projected revenue ($32.9 million).
FY2021 Q2 (October - December 2020)
Ridership decreases in the second quarter of FY2021
WSF ridership was approximately 3.26 million during the second quarter of FY2021, which was approximately 2.2 million (40.3%) fewer than the same quarter in FY2020, and 14.5% below projections. Ridership decreased on all routes compared to the same quarter in FY2020 because fewer people are traveling during the COVID-19 pandemic.
The Seattle/Bremerton route had the largest ridership decrease (69.7%) as 165,050 people traveled this route compared to the same quarter in FY2020 when 545,462. This decrease was partly due to WSF operating one vessel instead of two on this route for most of the second quarter when the M/V Spokane was taken out of service for unscheduled maintenance.
The domestic San Juan route experienced the smallest decrease in ridership (13.4%) as 340,797 people traveled the route compared to 393,473 during the second quarter of FY2020.
Farebox revenue down in second quarter of FY2021
WSF farebox revenue was $31.3 million for the second quarter of FY2021, about $10.6 million (25.3%) less than the same quarter in FY2020 ($41.9 million). The revenue decrease is less than the ridership decrease because more people are driving on the ferry, which is more expensive than passenger fares (walk-ons, etc.). Fare collection was about $759,000 (2.4%) below WSF projections for the quarter.
FY2021 Q1 (July - September 2020)
Ridership decreases during the first quarter of FY2021
WSF ridership was approximately 4.13 million during the first quarter of FY2021, which was 451,210 fewer riders than projected, and 3,188,327 (43.5%) fewer than the corresponding quarter in FY2020.
Due to the COVID-19 pandemic, more people are telecommuting, and fewer people are traveling. The number of vehicles and walk-on passengers were down, 74.3% and 54.9% respectively, compared to the same quarter in FY2020. To reduce the possible spread of the COVID-19 virus, vehicle passengers are encouraged to remain in their cars while on the ferry.
Revenue down this quarter, but exceeds projections
While revenue in the first quarter of FY2021 was almost $19 million less than the same quarter last year, the quarterly revenue exceeded projections (developed in June 2020) for FY2021. Projected revenue for the first quarter of FY2021 was $42,509,749; actual revenue collected was $44,585,658, which was 4.9% above projections.
With the increase in telecommuting there was a 64.3% decrease in use of multi-ride cards (which cover 10 one-way trips on a specific route for passengers and/or vehicles) in the first quarter of FY2021 compared to the same quarter in FY2020. The number of passengers using transit passes (which cover 31 round trips in a calendar month for passengers only) in the first quarter of FY2021 decreased by 83.7% compared to the same quarter in FY2020.