Washington State Ferries - Injuries & customer feedback
On this page:
Injuries & feedback
Source: Washington State Ferries
Note: Fiscal year - July 1 through June 30.
Performance analysis
FY2025 Q1 (July - September 2024)
Rate of passenger injuries unchanged, employee injuries increase
The rate of passenger injuries per million riders held steady in the first quarter of FY2025 at 1.9, the same as in the corresponding quarter of FY2024. This represents 11 total passenger injuries in the first quarter of both FY2025 and FY2024. However, the passenger injury rate did not meet WSF's annual goal of 1.0 injury or less per million riders.
For WSF employees, the rate of Occupational Safety and Health Administration recordable employee injuries per 10,000 revenue service hours increased from 5.4 in the first quarter of FY2024 to 9.0 in the same quarter of FY2025. This represents 25 total crew injuries in FY2025, compared to 15 in the first quarter of FY2024. The most reported injury type by far was pain/soreness, which increased to 17 incidents this year versus 11 in the same quarter last year. The employee injury rate did not meet WSF's annual goal of 7.6 injuries or less per 10,000 revenue service hours.
Rate of passenger complaints increases
In the first quarter of FY2025, WSF received 609 complaints and 20 compliments, compared to 504 complaints and 24 compliments during the same quarter of FY2024. To better understand this, we can calculate the ratio of complaints per 100,000 riders. Based on this method, there were 10.3 complaints per 100,000 riders in FY2025 and 8.7 complaints per 100,000 riders in FY2024, an increase of 1.6 complaints (19%) per 100,000 riders.
The two categories with the largest number of complaints in the first quarter of FY2025 were employee behavior with 117 (19.2% of complaints) and on-time performance with 88 (14.4% of complaints), representing 2.0 and 1.5 complaints per 100,000 riders, respectively.
Featured compliment:
I take the ferry many times a week...up to 5 times a week, and every one of the crew of the interisland ferries are absolutely wonderful. They are kind, efficient, and as a juvenile probation counselor that needs to travel to youth emergencies, they also value safety. Inter-Island workers are the best and Tilly is my favorite boat.
FY2024 Q4 (April - June 2024)
Passenger and employee injury rates decrease
The rate of passenger injuries was 0.80 per million riders in the fourth quarter of FY2024, a decrease from 1.42 per million riders in the corresponding quarter of FY2023. This represents four passenger injuries in total as compared to seven injuries in the same quarter the previous year. The passenger injury rate during the quarter met WSF's annual goal of having one or fewer than one injury per million riders.
The rate of Occupational Safety and Health Administration recordable crew injuries per 10,000 revenue service hours decreased to 6.5 in the fourth quarter of FY2024, down from 8.7 during the same period in FY2023. This represents 18 total crew injuries in FY2024 compared to 24 in the fourth quarter in FY2023. The crew injury rate for the quarter also met WSF's annual goal of having a rate of fewer than 7.6 crew injuries per 10,000 revenue service hours.
Rate of passenger complaints decreases
WSF received 354 complaints and 15 compliments during the fourth quarter of FY2024, compared to 440 complaints and 29 compliments during the same quarter in FY2023. One way to compare this information is to use a ratio of complaints per 100,000 riders. Based on this method, there were 7.0 complaints per 100,000 riders in FY2024 and 8.9 complaints per 100,000 riders in FY2023, a decrease of 1.9 complaints (21%) per 100,000 riders.
The category with the most complaints in the fourth quarter in both years was employee behavior with 1.3 complaints per 100,000 riders (64) in FY2024 compared to 1.9 complaints per 100,000 riders (93) in FY2023. The second highest category of complaints in FY2024, 1.1 per 100,000 riders (54), were schedule related.
Featured compliment:
I just wanted to say how impressed I was by your staff yesterday. I had [an operation] yesterday morning in Edmonds and rode the ferry back to Kingston in the afternoon. We had a form that let us get on in the front. When we showed one of your ferry workers, he was so sweet it almost made me cry. He asked if there was anything they could do to make the ride back easier such as parking us near restroom access etc. It really made my day. Just wanted to say keep up the good work! Y'all made a long stressful day end on a very good note. Thank you!!!
FY2024 Q3 (January - March 2024)
Rate of passenger injuries increases, rate of employee injuries decreases
The rate of passenger injuries per million riders increased from 0.80 in the third quarter of FY2023 to 1.04 in the same quarter of FY2024. This represents an increase in the raw number of injuries from three to four and missed WSF's goal of one or fewer injuries per million riders.
The rate of Occupational Safety and Health Administration recordable crew injuries per 10,000 revenue service hours was 4.8 in the third quarter of FY2024, down from 7.2 in the third quarter of FY2023. This was the lowest crew injury rate for any quarter since FY2020. There were 13 crew injuries in the third quarter of FY2024, six fewer than 19 in FY2023, and achieved WSF's goal of 7.6 employee injuries or fewer per 10,000 revenue service hours.
Rate of passenger complaints decreases
There were 149 customer complaints in the third quarter of FY2024 compared to 203 in the corresponding quarter of FY2023. This is a decrease in the rate per 100,000 riders from 5.4 in FY2023 to 3.9 in FY2024.
The category with the highest rate of complaints was employee behavior with 1.1 complaints per 100,000 riders. All other categories had less than 1.0 complaint per 100,000 riders. There were five compliments in the third quarter of FY2024 compared to 13 in FY2023.
WSF reservation agents provide friendly, reliable service
... Please know how very much I appreciate the help and service that I have consistently had in speaking to the WSF Reservation agents. [They are] knowledgeable, welcoming, and friendly. Even during busy and stressful times over the past few years, the telephone agents have been very helpful and patient. ...!
FY2024 Q2 (October - December 2023)
Passenger and employee injury rates increase
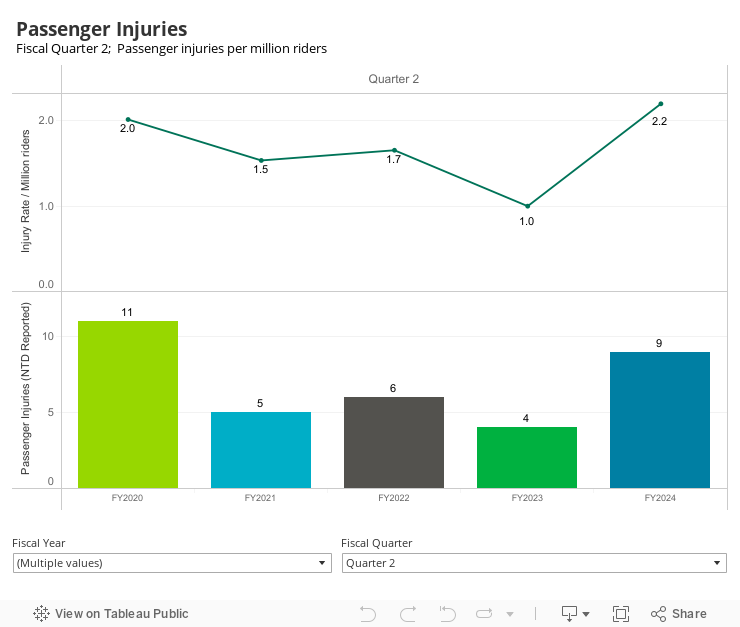
The rate of passenger injuries per million riders was 2.2 in the second quarter of FY2024, up 116% from 1.0 in the same quarter of FY2023. In raw numbers, this was an increase from four to nine passenger injuries in second quarter of FY2023 compared to the same quarter of FY2024. Passenger injuries are defined by the National Transit Database as any injury that results in transport to a medical facility. The passenger injury rate during the quarter (2.2) missed the annual WSF goal of 1.0 injuries or fewer per million riders.
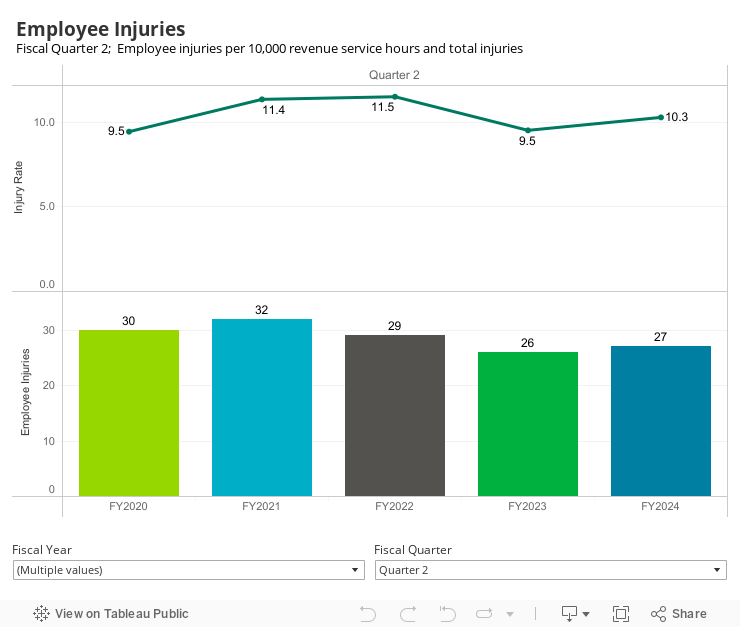
The rate of employee injuries reported to the Occupational Safety and Health Administration (OSHA) in the second quarter of FY2024 was 10.3 per 10,000 revenue service hours, an increase of 0.8 from the 9.5 per 10,000 revenue service hours in the same quarter in FY2023. There was one more employee injury in the second quarter of FY2024 (27) than in the same quarter of FY2023 (26). The employee injury rate was above the WSF annual goal of fewer than 7.6 employee injuries per 10,000 revenue service hours.
Of the 27 employee injuries reportable to OSHA during the second quarter of FY2024, the most frequently reported was pain and soreness with 14 injuries.
Rate of passenger complaints decreases
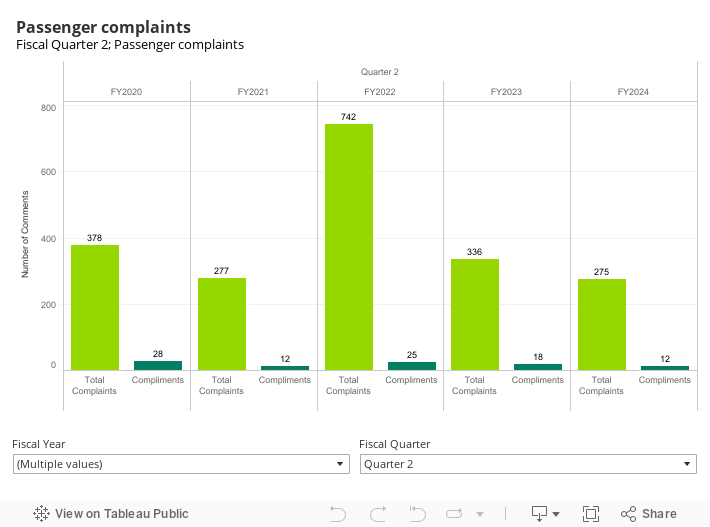
There were 275 complaints during the second quarter of FY2024, compared to 336 complaints in the same quarter last year. Expressed as a ratio related to ridership, there were 6.6 complaints per hundred thousand riders in FY2024, down from 8.4 in FY2023. The most common complaint was schedule with 1.4 per hundred thousand riders (58) followed by employee behavior at 1.3 per hundred thousand riders (53). There were 12 compliments in FY2024 as compared to 18 in the second quarter of FY2023.
WSF staff goes above and beyond
... "My car's battery died in the Southworth ferry line and … came running over with a battery pack charger to try and jumpstart it. After that didn't work, … tried jumping my car from another vehicle and finally pushed it off to a safe spot. … then let me use tools and the battery charger to try and get things going. I was very grateful for the help and the super friendly attitude. Thanks ...!
FY2024 Q1 (July - September 2023)
Rate of passenger injuries increases, rate of employee injuries decreases
The rate of passenger injuries per million riders increased from 1.8 in the first quarter of FY2023 to 1.9 in the corresponding quarter of FY2024. The number of injuries increased from 10 in FY2023 to 11 in FY2024. The passenger injury rate during the quarter did not meet WSF's annual goal of 1.0 injury or less per million riders.
For WSF employees, the rate of Occupational Safety and Health Administration recordable employee injuries per 10,000 revenue service hours decreased from 8.1 in the first quarter of FY2023 to 5.4 in the same quarter of FY2024. The number of injuries decreased from 22 to 15, however, data on hearing loss may be incomplete. The employee injury rate during the quarter met WSF's annual goal of 7.6 injuries or less per 10,000 revenue service hours.
Rate of passenger complaints decreases
There were 504 complaints in the first quarter of FY2024, a decrease from 580 during the same quarter in FY2023. The ratio of complaints per 100,000 riders was 10.43 in FY 2023 compared to 8.67 in FY2024. The largest number of complaints was regarding the schedule with 108 (21.4%), which represents 1.9 complaints per 100,000 riders. There were 24 compliments in this first quarter of FY2023, down from 32 in the same quarter of FY2023.
WSF staff goes above and beyond
... [An employee] from Colman Dock went above and beyond last night when the Bremerton ferry service was canceled, and my friend didn't have a way to contact me. She made sure I knew my friend would be on the Bainbridge ferry instead of Bremerton and then contacted the Bainbridge terminal to make sure my friend knew I got the message, and we were on our way, but would be late... THANK YOU ...!
FY2023 Q4 (April - June 2023)
Passenger and employee injury rates decrease
The rate of passenger injuries was 1.42 per million riders in the fourth quarter of FY2023, a decrease from 1.76 in the corresponding quarter of FY2022. This represents seven passenger injuries compared to eight in the same quarter in the previous year; the ratio is lower due to higher ridership in FY2023. The passenger injury rate during the quarter also missed WSF's annual goal of having one or fewer than one injury per million riders.
The rate of Occupational Safety and Health Administration recordable crew injuries per 10,000 revenue service hours decreased to 8.7 in the fourth quarter of FY2023, down from 10.5 during the same period in FY2022. This represents 24 injuries in FY2023 compared to 28 in the fourth quarter in FY2022; the ratio is lower due to more service hours in FY2023 under the Service Restoration Plan. The crew injury rate also missed WSF's annual goal of having a rate of fewer than 7.6 crew injuries per 10,000 revenue service hours.
Rate of passenger complaints increases
WSF received 440 complaints and 29 compliments during the fourth quarter of FY2023, compared to 356 complaints and 19 compliments during the same quarter in FY2022. One way to compare this information is to use a ratio of complaints per 100,000 riders. Based on this method, there were 8.92 complaints per 100,000 riders in FY2023 and 7.82 complaints per 100,000 riders in FY2022, an increase of 1.10 complaints (14%) per 100,000 riders.
The category with the most complaints in the fourth quarter in both years was employee behavior with 1.9 complaints per 100,000 riders (93) in FY2023 compared to 1.6 complaints per 100,000 riders (73) in FY2022. The second highest category of complaints in FY2023, 1.4 per 100,000 riders (70), were schedule related.
WSF staff maintains consistency in dynamic environments
Just want to say ... amazing job navigating Memorial Day ferry scheduling on the San Juans! Ferries breaking down, crew not showing up, lots of travelers. The scheduling and rescheduling and shifting boats around seemed like controlled chaos. Nobody likes problems that you & travelers had to deal with, but you did a great job under very challenging circumstances!
FY2023 Q3 (January - March 2023)
Rate of passenger injuries decreases, rate of employee injuries increases
The rate of passenger injuries per million riders decreased from 1.84 in the third quarter of FY2022 to 0.80 in the same quarter of FY2023. This represents a decrease in the raw number of injuries from six to three and achieved WSF's goal of one or fewer injuries per million riders.
The rate of Occupational Safety and Health Administration recordable crew injuries per 10,000 revenue service hours was 7.2 in the third quarter of FY2023, up from 6.7 in the third quarter of FY2022. There were 19 crew injuries in FY2023, three fewer than 16 in FY2022—this achieved WSF's goal of 7.6 employee injuries or fewer per revenue service hour.
Rate of passenger complaints decreases
There were 203 customer complaints in the third quarter of FY2023 compared to 371 in the corresponding quarter of FY2022. This is a decrease in the rate per 100,000 riders from 11.4 in FY2022 to 5.4 in FY2023.
The category with the highest rate of complaints was employee behavior with 1.7 complaints per 100,000 riders. All other categories had less than 1.0 complaint per 100,000 riders. There were 13 compliments in the third quarter of FY2023 compared to 32 in FY2022.
WSF staff ensures safety and comfort of passengers
Accolade for Ashley (WSF) of the... Bainbridge run. On February 3, 2023 I rode the ferry as a "scoot on" passenger as I am on a knee scooter for a broken ankle. When Ashley saw me getting on the boat she made sure the ramp was lowered enough for me to safely get on the boat. When I was seated she cam (sic) over and told me she let the crew know to keep the ramp level for me to easily disembark the boat. She went above and beyond the call of duty to make sure the ferry was safe and accessible for me. I really appreciated her care, concern, and courtesy. Her thoughtfulness made my day and made for a wonderful ferry trip...
FY2023 Q2 (October - December 2022)
Passenger and employee injury rates decrease
The rate of passenger injuries per million riders was 1.00 in the second quarter of FY2023, down 40% from 1.66 in the same quarter of FY2022. Passenger injuries are defined by the National Transit Database as any injury that results in transport to a medical facility. The passenger injury rate during the quarter (1.0) met the annual WSF goal of 1.0 injuries or fewer per million riders.
The rate of employee injuries reported to the Occupational Safety and Health Administration (OSHA) in the second quarter of FY2023 was 9.5 per 10,000 revenue service hours, a decrease of 2.0 from the 11.5 per 10,000 revenue service hours in the same quarter in FY2022. The employee injury rate was above the WSF annual goal of fewer than 7.6 employee injuries per 10,000 revenue service hours.
Of the 26 employee injuries reportable to OSHA during the second quarter of FY2023, the most frequently reported was pain and soreness with 16 injuries.
Rate of passenger complaints decreases significantly
There were 336 complaints during the second quarter of FY2023, compared to 742 complaints in the same quarter last year. Expressed as a ratio related to ridership, there were 8.4 complaints per million riders in FY2023, down 59% from 20.47 in FY2022. The most common complaint was employee behavior with 2.8 per million riders (112) followed by schedule at 1.7 per million riders (66). There were 18 compliments in the second quarter of FY2023 compared to 25 in the corresponding quarter of FY2022.
FY2023 Q1 (July - September 2022)
Passenger and employee injury rates increase
The rate of passenger injuries per million riders increased from 0.7 in the first quarter of FY2022 to 1.8 in the corresponding quarter of FY2023. The number of injuries in the first quarter increased from four in FY2022 to 10 in FY2023. The passenger injury rate during the quarter did not meet WSF's annual goal of 1.0 injury or less per million riders.
For WSF employees, the rate of Occupational Safety and Health Administration recordable employee injuries per 10,000 revenue service hours increased from 7.7 in the first quarter of FY2022 to 8.1 in the same quarter of FY2023. The number of injuries decreased from 23 to 22, however under the Alternate Service Plan, the reduction in service resulted in fewer revenue service hours in FY2023, which resulted in the injury rate increase. The employee injury rate during the quarter did not meet WSF's annual goal of 7.6 injuries or less per 10,000 revenue service hours.
Rate of passenger complaints increases
There were 580 complaints in the first quarter of FY2023, an increase from 541 during the same quarter in FY2022. The ratio of complaints per 100,000 riders was 10.43 in FY2023 compared to 9.46 in FY2022. The largest number of complaints were due to the schedule with 156 (26.9%) which represents 2.8 complaints per 100,000 riders. There were 32 compliments in this first quarter of FY2023, up from 14 in the same quarter of FY2022.
FY2022 Q4 (April - June 2022)
Passenger and employee injury rate increases
The rate of passenger injuries was 1.76 per million riders in the fourth quarter of FY2022, an increase from 0.63 in the corresponding quarter of FY2021. This represents five more passenger injuries than the same quarter in the previous year. The passenger injury rate during the quarter missed WSF's annual goal of having one or fewer injuries per million riders.
The rate of Occupational Safety and Health Administration recordable crew injuries per 10,000 revenue service hours increased from 8.7 in the fourth quarter of FY2021 to 10.5 during the same period in FY2022. This represents three more injuries than in the same quarter in FY2021, and missed WSF's annual goal of having a rate of fewer than 7.6 crew injuries per 10,000 revenue service hours.
Passenger complaints decrease for the quarter
WSF received 356 complaints and 19 compliments during the fourth quarter of FY2022, compared to 429 complaints and 25 compliments during the same quarter in FY2021. One way to compare this information is to use a ratio of complaints per 100,000 riders. Based on this method, there were 8.94 complaints per 100,000 riders in FY2021 and 7.82 complaints per 100,000 riders in FY2022, a decrease of 1.12 complaints per 100,000 riders. The category with the most complaints in the fourth quarter in both years was employee behavior with 2.5 per 100,000 riders (122) in FY2021 compared to 1.5 per 100,000 riders (73) in FY2022. The second highest category of complaints in FY2022, 1.4 (69), were related to schedules.
FY2022 Q3 (January - March 2022)
Rate of passenger injuries increases, rate of employee injuries decreases
The rate of passenger injuries per million riders increased from 1.27 in the third quarter of FY2021 to 4.72 in the same quarter of FY2022. This represents an increase in the raw number of injuries from four to six, and missed WSF's goal of one or fewer injuries per million riders.
The rate of Occupational Safety and Health Administration recordable crew injuries per 10,000 revenue service hours was 6.7 in the third quarter of FY2022, down from 10.1 in the third quarter of FY2021. There were 16 crew injuries in FY2022, 12 fewer than 28 in FY2021—this achieved WSF's goal of 7.6 employee injuries or fewer per revenue service hour.
Rate of passenger complaints increases
There were 371 customer complaints in the third quarter of FY2022 compared to 208 in the corresponding quarter of FY2021. This is an increase in the rate per 100,000 riders from 6.6 in FY2021 to 11.4 in FY2022.
The category with the highest rate of complaints was the schedule, with 3.7 complaints per 100,000 riders. Schedule complaints are related to a reduction in scheduled service, such as the alternate service plan and the inclement weather plan activated in the same quarter last year. The category with the second-highest rate of complaints was employee behavior with 2.9 complaints per 100,000 riders. There were 22 compliments in the third quarter of FY2022 compared to 10 in FY2021.
FY2022 Q2 (October - December 2021)
Passenger and employee injury rates increase
The rate of passenger injuries per million riders was 1.66, up 8% from 1.54 in the same quarter of FY2021. Passenger injuries are defined by the National Transit Database as any injury that results in transport to a medical facility. The passenger injury rate during the quarter (1.66) was above the WSF goal of 1.0 injury or fewer per million riders.
The rate of employee injuries reportable to the Occupational Safety and Health Administration in the second quarter of FY2022 was 11.5 per 10,000 revenue service hours, a slight increase from 11.4 per 10,000 revenue service hours in the same quarter in FY2021. The employee injury rate was above WSF's annual goal of fewer than 7.6 employee injuries per 10,000 revenue service hours. Of the 29 employee injuries reportable to the Occupational Health and Safety Administration, the most frequently reported was pain and soreness (10) and hearing loss (10).
Rate of passenger feedback increases
There were 742 complaints, compared to 277 complaints in the same quarter in FY2021. Expressed as a ratio related to ridership, there were 20.47 complaints per million riders, up from 8.51 for the same quarter in FY2021. The most common complaint was related to the schedule with 8.5 per million riders (276) followed by employee behavior at 4.8 per million riders (157). Compliments were 0.7 per million riders (25) as compared to 0.4 (12) in the second quarter of FY2021.
FY2022 Q1 (July - September 2021)
Passenger injuries decrease, employee injuries increase
The rate of passenger injuries per million riders decreased from 0.97 in the first quarter of FY2021 to 0.70 in the corresponding quarter of FY2022. The number of injuries in each fiscal year was four, but with an increase in ridership, the rate per million riders decreased. The passenger injury rate during the quarter achieved WSF's annual goal of 1.0 injury or less per million riders.
The rate of Occupational Safety and Health Administration recordable crew injuries per 10,000 revenue service hours decreased from 7.8 in the first quarter of FY2021 to 7.7 in the same quarter of FY2022. This represents an increase in the number of injuries from 20 in the first quarter of FY2021 to 23 in the same quarter of FY2022, but due to the increase in revenue service hours in FY2022 the rate decreased.
Rate of passenger complaints decreases
There were 541 complaints in the first quarter of FY2022, a decrease from 763 during the same quarter in FY2021. The ratio of complaints per 100,000 riders was 9.46 in FY2022 compared to 18.46 in the first quarter of FY2021. The largest number of complaints was employee behavior with 149 (27.5%) which represents 2.6 complaints per 100,000. There were 14 compliments in this first quarter of FY2022, down from 18 in the same quarter of FY2021.
FY2021 Q4 (April - June 2021)
Passenger injury rate decreases while employee injury rate increases
The rate of passenger injuries was 0.63 per million riders in the fourth quarter of FY2021, a decrease from 1.19 in the corresponding quarter of FY2020. This represents three total passenger injuries per quarter in both years, but the rate was lower in FY2021 due to higher ridership.
The passenger injury rate during the quarter achieved WSF's annual goal of having one or fewer injuries per million riders.
The rate of Occupational Safety and Health Administration recordable crew injuries per 10,000 revenue service hours increased from 6.0 in the fourth quarter of FY2020 to 8.7 during the same period in FY2021. This represents 10 more injuries than in the same quarter in FY2020, and missed WSF's annual goal of having a rate of fewer than 7.6 crew injuries per 10,000 revenue service hours.
WSF listens to feedback from passengers
WSF received 429 complaints and 25 compliments during the fourth quarter of FY2021, compared to 379 complaints and 11 compliments during the same quarter in FY2020.
One way to compare this information is to use a ratio of complaints per 100,000 riders. Based on this method, there were 15.0 complaints per 100,000 riders in FY2020 and 8.94 complaints per 100,000 riders in FY2021, a decrease of 6.1 complaints per 100,000 riders.
The category with the most complaints in both years was employee behavior with 2.5 complaints per 100,000 riders (122) in FY2021 compared to 4.4 per 100,000 riders (111) in the fourth quarter of FY2020. The second highest category of complaints were related to vessel/terminal operations with 1.2 complaints per 100,000 riders.
FY2021 Q3 (Januarly - March 2021)
Rate of passenger injuries decreases, rate of employee injuries increases
The rate of passenger injuries per million riders improved from 1.96 in the third quarter of FY2020 to 1.27 in the same quarter of FY2021. This represents four fewer injuries than the third quarter of FY2020, but missed WSF's goal of one or fewer injuries per million riders.
The rate of Occupational Safety and Health Administration recordable crew injuries per 10,000 revenue service hours increased from 6.3 in the third quarter of FY2020 to 10.1 in the third quarter of FY2021. This represents nine more injuries than in the same quarter of FY 2020, and missed WSF's goal of 7.6 or fewer injuries per 10,000 revenue service miles.
Passenger complaints decrease for the quarter
There were 305 complaints in the third quarter of FY2020 and 208 during the same period in FY2021. As such, the ratio of complaints per 100,000 riders was 7.47 in the third quarter of FY2020, and 6.63 in the same quarter of FY2021. The area with the most complaints was employee behavior with 58 (15.7%), which represents 1.8 complaints per 100,000 riders. There were 10 compliments in the third quarter of FY2021, compared to 18 in the same quarter of FY2020.
FY2021 Q2 (October - December 2020)
Passenger injuries decrease, employee injuries increase
The rate of passenger injuries per million riders was 1.54 in the second quarter of FY2021, down 24% from 2.02 in the same quarter of FY2020. Passenger injuries are defined by the National Transit Database reporting system as any injury that results in transport to a medical facility. The passenger rate during the quarter was 1.54 above the WSF goal of 1.0 injury or fewer per million riders.
The rate of employee injuries reportable to the Occupational Safety and Health Administration in the second quarter of FY2021 was 11.4 per 10,000 revenue service hours, an increase from 9.5 per 10,000 revenue service hours in the same quarter last year. This represents two more injuries than the same quarter in FY2020. The employee injury rate (11.4) was above WSF annual goal of having fewer than 7.6 employee injuries per 10,000 revenue service hours.
Rate of passenger complaints increases
There were 277 complaints during the second quarter of FY2021, compared to 378 complaints in the same quarter last year. Expressed as a ratio related to ridership, there were 8.51 complaints per million riders in FY2021 and 6.93 in FY2020.
FY2021 Q1 (July - September 2020)
Passenger injuries decrease, employee injuries increase
The rate of passenger injuries per million riders decreased from 1.91 in the first quarter of FY2020 to 0.97 in the corresponding quarter of FY2021. This represents a decrease in injuries from 14 to four. The passenger injury rate during the quarter exceeded WSF's goal of 1.0 injury or less per million riders.
The rate of Occupational Safety and Health Administration recordable crew injuries per 10,000 revenue service hours increased from 4.1 in the first quarter of FY2020 to 7.8 in the same quarter of FY2021. This represents an increase in injuries from 14 in FY2020 to 20 in the corresponding quarter of FY2021.
Rate of passenger complaints increases
There were 763 complaints in the first quarter of FY2021, a decrease from 1,013 during the same quarter in FY2020. However, the ratio of complaints per million riders was 18.5 in FY2021, up from 13.8 during the same quarter in FY2020. There were 282 (37% or 6.82 per million passengers) complaints associated with COVID-19 related to late boats and reduced schedules, people not wearing masks, and refund delays. The largest number of complaints by category was employee behavior with 177 (23.2%) which represents 4.3 complaints per million riders. There were 18 compliments in this first quarter of FY2021, down from 36 in the same quarter of FY2020.