
Multimodal mobility dashboard - Vancouver region
Region executive summary
This dashboard provides detailed multimodal mobility analyses of four urban highway corridors in the Vancouver region, which includes
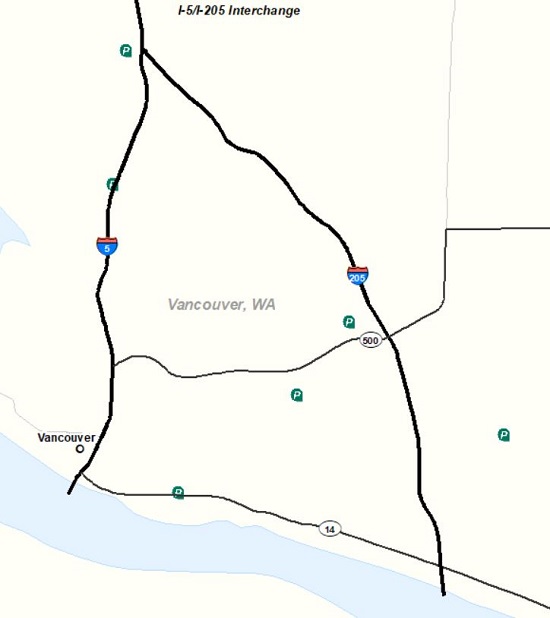
- Interstate 5 between the Interstate Bridge and the I-205 interchange
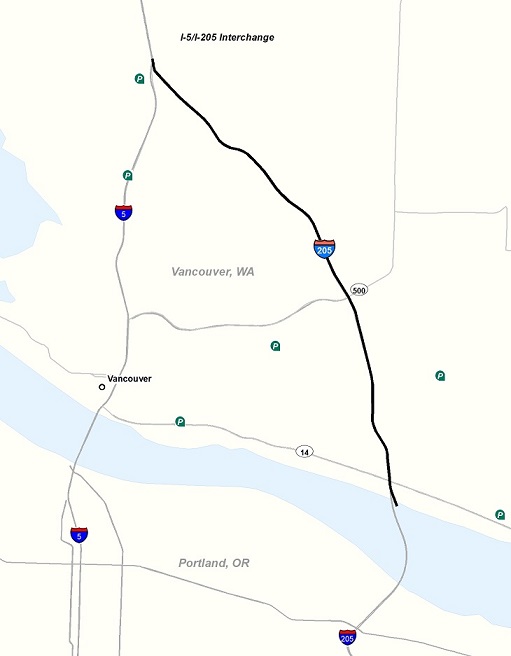
- Interstate 205 between the Glenn Jackson Bridge and the I-5 interchange
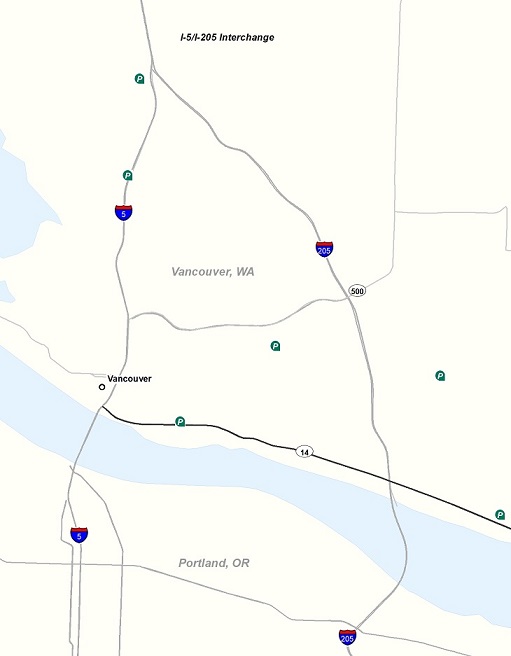
- State Route 14 between the I-5 interchange and Camas
- State Route 500 between the I-5 interchange and I-205 interchange
The peak periods for all corridors in the Vancouver region are 6-9 a.m. and 3-6 p.m.
2024 Highlights- In 2024, 754 million person miles were traveled, down 0.6% from 758.8 million person miles in 2023
- Delay increased 20.7% from 106,338 hours in 2023 to 128,339 hours in 2024. There was no delay on SR 500
- In 2024, buses moved up to 0.3% of travelers compared to 2023, where buses moved up to 0.3% of travelers during weekday commutes
- Park and ride lots had an average utilization rate of 15.2% in 2024, compared to 13.3% in 2023

Source: WSDOT Transportation Safety and Systems Analysis Division and WSDOT TRACFLOW (https://tracflow.wsdot.wa.gov/)
Interstate 5
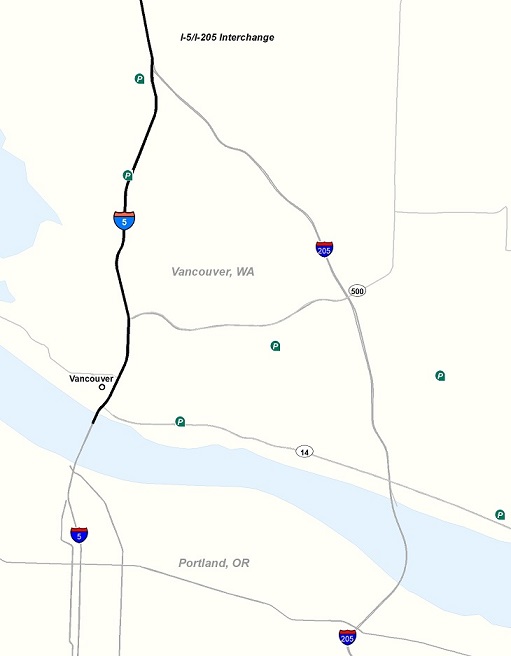
The Interstate 5 corridor in the Vancouver region runs between the Interstate Bridge over the Columbia River and the I-205 interchange. It is a key commute and economic corridor in the region. WSDOT classifies the I-5 corridor between the Interstate Bridge and the I-205 interchange as a T-1 freight corridor, meaning that trucks carry more than 10 million tons of freight on this corridor annually. The I-5 corridor is served by transit buses and is also paralleled by the Amtrak Cascades passenger rail line. Click the green bar below for more information on Interstate 5 multimodal mobility analysis.
Multi-year trends
Due to historic decreases in 2020 during the COVID-19 pandemic, analysis here is compared to 2019 to provide a better perspective on whether trends are returning to normal (Unless otherwise noted travel is measured in general purpose lanes).
- There were 234.6 million person miles traveled in 2024 which was 0.5% lower than the 235.8 million in 2019
- Vehicle delay in 2024 was 54.3 thousand hours, which was 48.0% less than the 104.4 thousand hours in 2019
- Peak morning and evening commute times continued to increase in 2024 and were equal to 2019 commute times in some locations
- Severe congestion levels continued to grow in 2024, and neared pre-pandemic levels
- Throughput productivity improved in 2024, and it remains higher than 2019 pre-pandemic levels
- Buses in 2024 transported less than 0.1% of weekday commuters, compared to 2019, where buses moved up to 7.7%
- Park and ride lot usage in 2024 averaged 15.2% compared to 55.0% in 2019
Interstate 205
Interstate 205 is a key commute and economic corridor in the Vancouver region, running from the Glenn Jackson Bridge over the Columbia River to the I-5 interchange. WSDOT classifies this corridor as a T-1 freight corridor, meaning that trucks carry more than 10 million tons of freight on this corridor annually. The I-205 corridor is served by transit buses. Click the green bar below for more information on Interstate 205 multimodal mobility analysis.
Multi-year trends
Due to historic decreases in 2020 during the COVID-19 pandemic, analysis here is compared to 2019 to provide a better perspective on whether trends are returning to normal (Unless otherwise noted travel is measured in general purpose lanes).
- There were 287.4 million person miles traveled in 2024 the same as in 2019
- Vehicle delay in 2024 was 59.1 thousand hours, which was 44.9% less than the 107.3 thousand hours in 2019
- Peak morning and evening commute times continued to increase in 2024 and were equal to 2019 commute times in some locations
- Severe congestion levels continued to grow in 2024, and were still below 2019 pre-pandemic levels
- Throughput lossoccured in southbound lanes in 2024, and it remains lower than 2019 pre-pandemic levels
- Buses in 2024 transported less than 0.2% of weekday commuters, compared to 2019, where buses moved up to 5.2%
State Route 14
State Route 14 runs along the north bank of the Columbia River and is a key commute and economic corridor in the Vancouver region. WSDOT classifies the SR 14 corridor between Camas and the I-5 interchange as a T-1 freight corridor, meaning that trucks carry more than 10 million tons of freight on this corridor annually. The corridor is served by transit buses. Click the green bar below for more information on State Route 14 multimodal mobility analysis.
Multi-year trends
Due to historic decreases in 2020 during the COVID-19 pandemic, analysis here is compared to 2019 to provide a better perspective on whether trends are returning to normal (Unless otherwise noted travel is measured in general purpose lanes).
- There were 161.1 million person miles traveled in 2024 which was 11.2% lower than the 181.5 million in 2019
- Vehicle delay in 2024 was 14,900 hours, which was 34.2% more than the 11,100 hours in 2019
- Peak morning and evening commute times stayed stable in 2024 and were equal to 2019 commute times in some locations
- Severe congestion levels continued to grow in 2024, and were still below 2019 pre-pandemic levels
- Throughput productivity dropped in 2024, and is below 2019 pre-pandemic levels
- Buses in 2024 transported less than 0.1% of weekday commuters, compared to 2019, where buses moved up to 6.8%
State Route 500
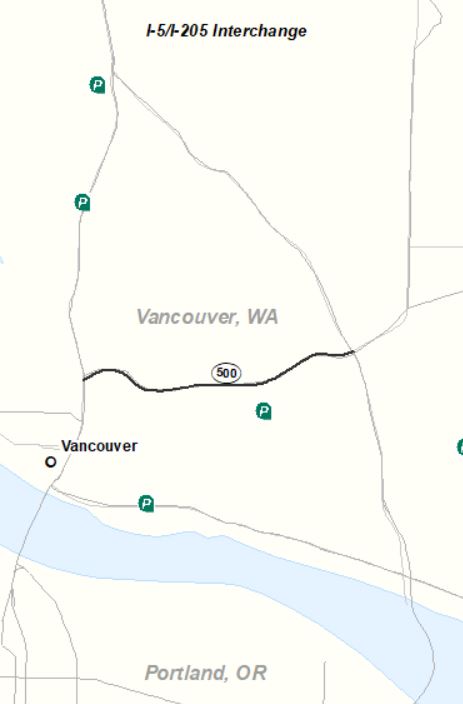
State Route 500 runs through central Vancouver and is a key commute and economic corridor in the region. WSDOT classifies the SR 500 corridor between Fourth Plain Boulevard and the I-5 interchange as a T-2 freight corridor, meaning that trucks carry between 4 million and 10 million tons of freight on this corridor annually. The corridor is served by transit buses. Click the green bar below for more information on State Route 500 multimodal mobility analysis.
Multi-year trends
Due to historic decreases in 2020 during the COVID-19 pandemic, analysis here is compared to 2019 to provide a better perspective on whether trends are returning to normal (Unless otherwise noted travel is measured in general purpose lanes).
- There were 70.9 million person miles traveled in 2024 which was 5.7% lower than the 75.2 million in 2019
- SR 500 experience no annual vehicle delay from 2019-2024
- Peak morning and evening commute times stayed stable in 2024 and were equal to 2019 commute times in some locations
- Severe congestion levels were similar in 2019 and 2024
- There was no throughput loss on SR 500 between 2019 and 2024