Vancouver region Interstate 5 - Dashboard
On this page:
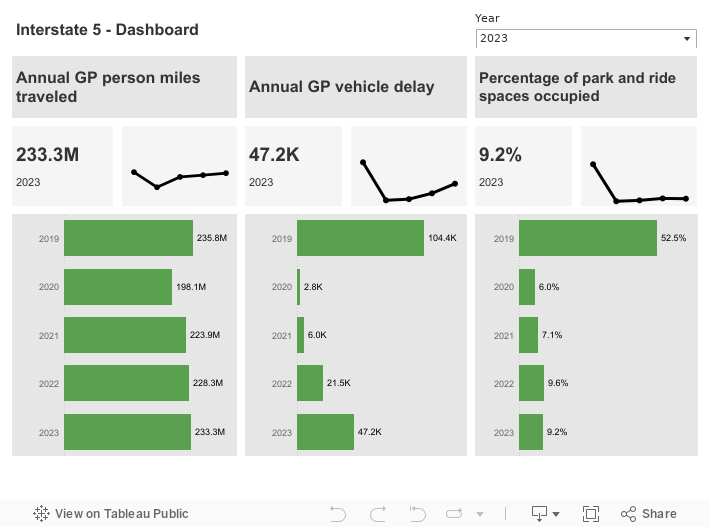
Performance indicators for I-5 in the Vancouver region
Indicators
This dashboard shows three multimodal performance indicators of highway performance for Interstate 5 in the Vancouver region:
- Annual general purpose (GP) lane person miles traveled
- Annual GP vehicle delay
- Percentage of park and ride spaces occupied.
For details on methodology to calculate person miles traveled and vehicle delay, refer to WSDOT's Handbook for Corridor Capacity Evaluation (PDF 5.9 MB).
Sources: WSDOT Transportation Safety and Systems Analysis Division and WSDOT TRACFLOW (https://tracflow.wsdot.wa.gov/)
Performance highlights
In 2023, annual person miles traveled and vehicle delay increased from 2022 due to the ongoing recovery of traffic volume in the wake of COVID-19. However, annual person miles traveled was getting close to the pre-pandemic level but vehicle delay is significantly under the pre-pandemic level.
Approximately 233.3 million person miles were traveled in GP lanes on I-5 between the I-205 interchange and the Interstate Bridge, up 2.2% from 228.3 million in 2022. Travelers on this corridor experienced 47,200 hours of vehicle delay in 2023, up about 119.5% from 21,500 hours in 2022.
In 2023, 9.2% of parking spaces at park and ride lots along this corridor were occupied, down from 9.6% in 2022.
In 2022, annual person miles traveled and vehicle delay increased from 2021 due to the ongoing recovery of traffic volume in the wake of COVID-19. However, annual person miles traveled was getting close to the pre-pandemic level but vehicle delay is significantly under the pre-pandemic level. Nearly 228.3 million person miles were traveled on I-5 between the I-205 interchange and the Interstate Bridge, up 2% from 223.9 million in 2021. Travelers on this corridor experienced 21,500 hours of vehicle delay in 2021, up about 260% from 6,000 hours in 2021. 9.6% of parking spaces at park and ride lots along this corridor were occupied in 2022, up 2.5% from 7.1% in 2021.
In 2021, annual person miles traveled and vehicle delay increased from 2020 due to the recovery of traffic volume in the wake of COVID-19. However, annual person miles and vehicle delay were still under the pre-pandemic levels. Nearly 223.9 million person miles were traveled on I-5 between the I-205 interchange and the Interstate Bridge, up 13% from 198.1 million in 2020. Travelers on this corridor experienced 6,000 hours of vehicle delay in 2021, up about 110% from 2,800 hours in 2020. 7.1% of parking spaces at park and ride lots along this corridor were occupied in 2021, up 1.1% from 6.0% in 2020.
In 2020, the statewide response to COVID-19 resulted in a significant reduction in person miles traveled and annual delay. Nearly 198.1 million person miles were traveled on I-5 between the I-205 interchange and the Interstate Bridge, down 16% from 235.8 million from 2019. Travelers on this corridor experienced 2,800 hours of vehicle delay in 2020, down just over 97% from 104,400 in 2019. Approximately 6% of parking spaces at park and ride lots along this corridor were occupied in 2020, down 46.5% from 52.5% in 2019.
In 2019, nearly 235.8 million person miles were traveled on I-5 between the I-205 interchange and the Interstate Bridge, down 1.4% from 239.2 million from 2018. Travelers on this corridor experienced 104,400 hours of vehicle delay in 2019, up 12.8% from 92,500 in 2018. Approximately 52.5% of the parking spaces at park and ride lots along this corridor were occupied in 2019, no change from 2018.