Multimodal Mobility Dashboard - Central Puget Sound
Region executive summary
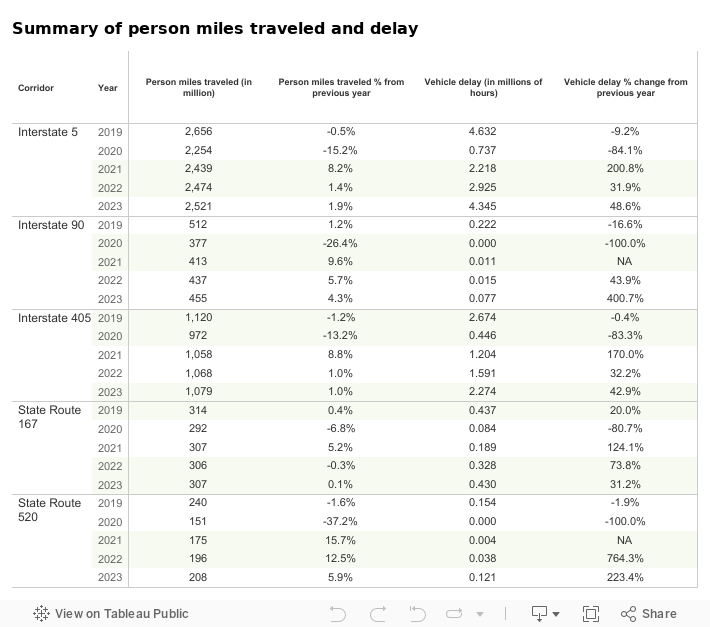
This dashboard provides detailed multimodal mobility analyses of five urban highway corridors in the central Puget Sound region, which includes
- Interstate 5 between Federal Way and Everett
- Interstate 405 between Tukwila and Lynnwood
- Interstate 90 between Seattle and Issaquah
- State Route 520 between Seattle and Redmond
- State Route 167 between Auburn and Renton
Central Puget Sound HOV performance analysis is also included and the peak periods for the corridors are 5-10 a.m. and 2-8 p.m.
2023 Highlights
- In 2023, the average central Puget Sound region, highway corridors saw about 4.56 billion person miles traveled, marking a nearly 2% rise from 4.48 billion person miles in 2022
- Delay on central Puget Sound region highway corridors increased 49% from 4.9 million hours in 2022 to 7.3 million hours in 2023
- In the central Puget Sound region, toll facilities saw roughly 6.4 million person miles traveled on average weekdays, 6.7% more than 6.0 million in 2022
- Public transportation ridership has been experiencing a slow, steady recovery but remains well below pre-pandemic levels. In 2023, buses moved up to 23.7% of travelers compared to 2022, where buses moved up to 8.9% of travelers during weekday commutes in central Puget Sound highway corridors.
- Park and ride lots in this corridor had an average utilization rate of 38.3% in 2023 compared to 29.6% in 2022

Source: WSDOT Transportation Safety and Systems Analysis Division and WSDOT TRACFLOW (https://tracflow.wsdot.wa.gov/)
Interstate 5
Interstate 5 in the central Puget Sound region runs between Federal Way and Everett, passing through Seattle. It is the most important commute and economic highway corridor in the region. WSDOT classifies I-5 between Federal Way and Everett as a T-1 freight corridor, meaning trucks using it carry more than 10 million tons of freight annually. I-5 is served by transit buses, Link Light Rail, Sounder commuter rail, high occupancy vehicle lanes and Amtrak Cascades passenger rail. It is also part of the "West Coast Electric Highway," which has an extensive network of electric vehicle charging stations every 25 to 50 miles. Click the green bar below for additional information on Interstate 5 multimodal mobility analysis.

Multi-year trends
General purpose lane person miles traveled and vehicle delay:
- Annual GP person miles traveled decreased by 4.9% from 2.65 billion in 2019 to 2.52 billion in 2023
- Annual GP vehicle delay decreased by 6.5% from 4.6 million hours of vehicle delay in 2019 to 4.3 million hours in 2023
Commute times:
- Commute times for peak morning and evening commutes continued to increase in 2023 due to the ongoing recovery of traffic volumes
- The 22 mile evening commute from Seattle to Federal Way in the GP lanes took an average of 43 minutes in 2019 and 45 minutes in 2023
Delay:
- Annual average daily vehicle hours of delay on northbound I-5 at the I-90 interchange increased 1.1% from 635.6 hours in 2019 compared to 642.8 hours in 2023
Severe congestion:
- Severe congestion continued to increase in 2023, however, it was still lower on most routes than pre-pandemic levels. For example, at 3:55 p.m. speeds on I-5 from Seattle to Everett at 3:55 p.m. were below 36 mph on 78.3% of weekdays in 2023 compared to 84% in 2019.
Throughput:
- During the evening commute in 2023 throughput productivity decreased by two percentage points on I-5 southbound at South 188th Street where vehicle throughput was at 74% compared to 76% in 2019
Transit:
- In 2023, buses moved up to 19.9% of travelers compared to 2019, where buses moved up to 27.7% of travelers during weekday commutes
Park and rides:
- In 2023, park and ride lot usage averaged 42.3% compared to 86.1% in 2019
Interstate 405
Interstate 405 is a key commute and economic corridor in central Puget Sound region, running parallel to I-5 between Tukwila and Lynnwood. WSDOT classifies I-405 corridor between Tukwila and Lynnwood as a T-1 freight corridor, meaning trucks carry more than 10 million tons of freight on this corridor annually. The I-405 corridor is served by transit buses, HOV lanes and, between Bellevue and Lynnwood, by Express Toll Lanes (ETLs). For detailed information about the I-405 ETLs, see I-405 Express Toll Lanes Between Bellevue and Lynnwood | WSDOT (wa.gov). Click the green bar below for more information on Interstate 405 multimodal mobility analysis.

Multi-year trends
General purpose lane person miles traveled and vehicle delay:
- Annual GP person miles traveled decreased by 2.7% from 1.11 billion in 2019 to 1.08 billion in 2023
- Annual GP vehicle delay decreased by 15.0% from 2.67 million hours of vehicle delay in 2019 to 2.27 million in 2023
Commute times:
- Commute times for the peak morning and evening commutes continued to increase in 2023 due to the ongoing recovery of traffic volumes
- The evening 13-mile commute from Bellevue to Tukwilla in the GP lanes took an average of 38 minutes in 2019 and 41 minutes in 2023
Delay:
- Annual average daily vehicle hours of delay on southbound I-405 approaching the I-90 interchange decreased 7.7% in 2023 with 408.5 hours compared to 442.4 hours in 2019
Severe congestion:
- Severe congestion continued to increase in 2023, however, it was still lower than in 2019 pre-pandemic levels. For example, at 7:20 a.m. speeds on I-405 from Everett to Bellevue were below 36 mph on 69.2% of weekdays compared to 87.1% in 2019.
Throughput:
- During the morning commute in 2023 throughput productivity increased by five percentage points on northbound I-405 at SR 169 where vehicle throughput was 46% compared to 41% in 2019.
Transit:
- In 2023, buses moved up to 3.5% of travelers compared to 2019, where buses moved up to 9.3% of travelers during weekday commutes
Park and rides:
- In 2023, park and ride lot usage averaged 36.4% compared to 93.7% in 2019
Interstate 90
Interstate 90 runs parallel to SR 520 across Lake Washington and is a key commute and economic corridor connecting I-5 and I-405 in the central Puget Sound region. WSDOT classifies I-90 between Seattle and Issaquah as a T-1 freight corridor, meaning that trucks using it carry more than 10 million tons of freight on this corridor annually. I-90 is served by transit buses and high occupancy vehicle lanes. The I-90 floating bridge is the non-tolled alternative to SR 520 across Lake Washington. Click the green bar below for more information on Interstate 90 multimodal mobility analysis.

Multi-year trends
General purpose lane person miles traveled and vehicle delay:
- Annual GP person miles traveled decreased by 11.1% from 512.0 million in 2019 to 455.4 million in 2023
- Annual GP vehicle delay decreased by 65.0% from 220,000 hours of vehicle delay in 2019 to 77,000 hours in 2023
Commute times:
- The evening-nine mile commute from Seattle to Bellevue in the GP lanes took an average of 16 minutes in 2019 and 11 minutes in 2023
Delay:
- Annual aveage daily vehicle hours of delay on westbound I-90 at Eastgate decreased 70.0% in 2023 to 39.7 hours compared to 132.7 hours in 2019
Severe congestion:
- Severe congestion continued to increase in 2023, however, it was still lower than pre-pandemic levels. For example, at 5:10 p.m. between Seattle and Bellevue speeds below 36 mph on 9.9% of weekdays in 2023 compared to 23.3% in 2019.
Throughput:
- There was no loss of throughput productivity in 2023 compared to 23.0% in 2019
Transit:
- In 2023, buses moved 0.2% of travelers compared to 19.9% in 2019 on I-90 westbound at the floating bridge during weekday commutes
Park and rides:
- In 2023, park and ride lot usage averaged 26.8% compared to 97.1% in 2019
State Route 520
State Route 520 is a key commute and economic corridor in the central Puget Sound region, connecting Seattle to Eastside suburbs and I-5 to I-405. WSDOT classifies SR 520 between Seattle and Redmond as a T-1 freight corridor, meaning that trucks using it carry more than 10 million tons of freight annually. SR 520 is served by transit buses and high occupancy vehicle lanes, and the SR 520 Evergreen Point Floating Bridge is tolled in both directions. For detailed information on the tolling of the SR 520 floating bridge, refer to SR 520 Bridge Tolling | WSDOT (wa.gov). Click the green bar below for more information on State Route 520 multimodal mobility analysis.

Multi-year trends
General purpose lane person miles traveled and vehicle delay:
- Annual GP person miles traveled decreased by 13.4% from 240.0 million in 2019 to 207.8 million in 2023
- Annual GP vehicle delay decreased by 21.4% from 154,000 hours of vehicle delay in 2019 compared to 121,000 hours in 2023
Commute times:
- The 13-mile morning commute from Redmond to Seattle in the GP lanes took an average of 25 minutes in 2019 and 24 minutes in 2023
Delay:
- Annual average daily vehicle hours of delay on westbound SR 520 at I-405 increased by 15.1% from 57.7 hours in 2019 compared to 66.4 hours in 2023
Severe congestion:
- Severe congestion continued to increase in 2023, however, it was still lower than in 2019, (pre-pandemic levels). For example, at 4:50 p.m. between Redmond and Bellevue speeds on this commute were below 36 mph on 79.8% of weekdays in 2023 compared to 86.8% in 2019.
Throughput:
- Westbound travel on SR 520 improved in 2023 as vehicle throughput increased to 75% to 77% of maximum throughput at the most congested times compared to 60% to 71% in 2019
Transit:
- In 2023, buses moved up to 1.5% of travelers compared to 2019, where buses moved up to 41.8% of travelers during weekday commutes
Park and rides:
- In 2023, park and ride lot usage averaged 37.6% compared to 90.0% in 2019
State Route 167
State Route 167 is a key commute and economic corridor in the central Puget Sound region that functions as an extension of I-405 south of the Tukwila/Renton area. WSDOT classifies SR 167 between Auburn and Renton as a T-1 freight corridor, meaning that trucks using it carry more than 10 million tons of freight annually. SR 167 corridor is served by Sounder commuter rail, transit buses, and high occupancy toll lanes. I-405 and SR 167 are connected by direct connection that provides seamless connection between the HOT lanes on SR 167 and the high occupancy vehicle lanes on I-405 in Renton. For detailed information about the SR 167 HOT lanes, refer to SR 167 HOT Lanes | WSDOT (wa.gov). Click the green bar below for more information on State Route 167 multimodal mobility analysis.

Multi-year trends
General purpose lane person miles traveled and vehicle delay:
- Annual GP person miles traveled decreased by 2.2% from 313.5 million in 2019 to 306.7 million in 2023
- Annual GP vehicle delay was down by 1.6% from 437,000 hours of vehicle delay in 2019 to 430,000 hours in 2023
Commute times:
- Commute times for peak morning and evening commutes continued to increase in 2023 due to the ongoing recovery of traffic volumes
- The 10-mile evening commute from Renton to Auburn in the GP lanes took an average of 23 minutes in 2019 and 25 minutes in 2023
Delay:
- Annual average daily vehicle hours of delay on southbound SR 167 in Renton increased 58.3% in 2023 with 193.5 hours compared to 122.2 hours in 2019
Severe congestion:
- Severe congestion continued to increase in 2023, and neared pre-pandemic levels. For example, at 7:40 a.m. speeds on this commute were below 36 mph on 77.4% of weekdays in 2023 the same amount in 2019
Throughput:
- During the morning commute in 2023, throughput productivity decreased by four percentage points on SR 167 at 84th Avenue South, where vehicle throughput was 85% compared to 89% in 2019
Transit:
- In 2023, buses transported less than 0.1% of travelers, compared to 2019, where buses moved up to 2.8% of travelers during weekday commutes
Park and rides:
- In 2023, park and ride lot usage averaged 48.3% compared to 86.9% in 2019
High Occupancy Vehicle Trip Analysis
High occupancy vehicle (HOV) lanes are reserved for carpools, vanpools, buses, motorcycles or any vehicle carrying a minimum number of people (either two or three, depending on the location and time of day), in addition to certain other vehicles granted access by the Legislature.
The central Puget Sound region freeway network includes a system of HOV lanes designed to provide faster and more reliable options for travelers. This system also enhances the efficient operation of the freeway network by moving more people in fewer vehicles than adjacent general purpose (GP) lanes.
About 325 lane-miles of the planned 369-mile Puget Sound region HOV network have been completed. These figures reflect the HOV freeway system and exclude ramps and arterials; the planned freeway lane-miles have been updated based on new projects funded through Connecting Washington and additional HOV options such as high occupancy toll lanes and express toll lanes. Click the green bar below for more information on HOV performance analysis.

Multi-year trends
Central Puget Sound High Occupancy Vehicle Lanes
HOV Person throughput:
- HOV person throughput decreased 1.5% at the I-5 South Everett HOV lanes from 18,823 in 2019 to 18,548 in 2023
HOV Person miles traveled:
- HOV person miles traveled decreased 16.9% from 7.65 million in 2019 to 6.37 million in 2023
HOV Reliability:
- One of the 10 HOV commutes monitored met the HOV standard for speed and reliability performance in 2019, compared to three of 10 in 2023