
Central Puget Sound Interstate 90 - Transit ridership
On this page:
Measures of public transit ridership on the I-90 corridor in the central Puget Sound region.
Transit ridership
WSDOT works with transit agencies in major urban areas throughout the state to collect data on the number of transit vehicles and passengers that pass specific points on select urban highway corridors, including the I-90 corridor in the central Puget Sound region. WSDOT combines this data with its highway vehicle and person throughput data to produce the measures below. For more information on how WSDOT calculates vehicle and person throughput, see WSDOT's Handbook for Corridor Capacity Evaluation (PDF 5.9MB).
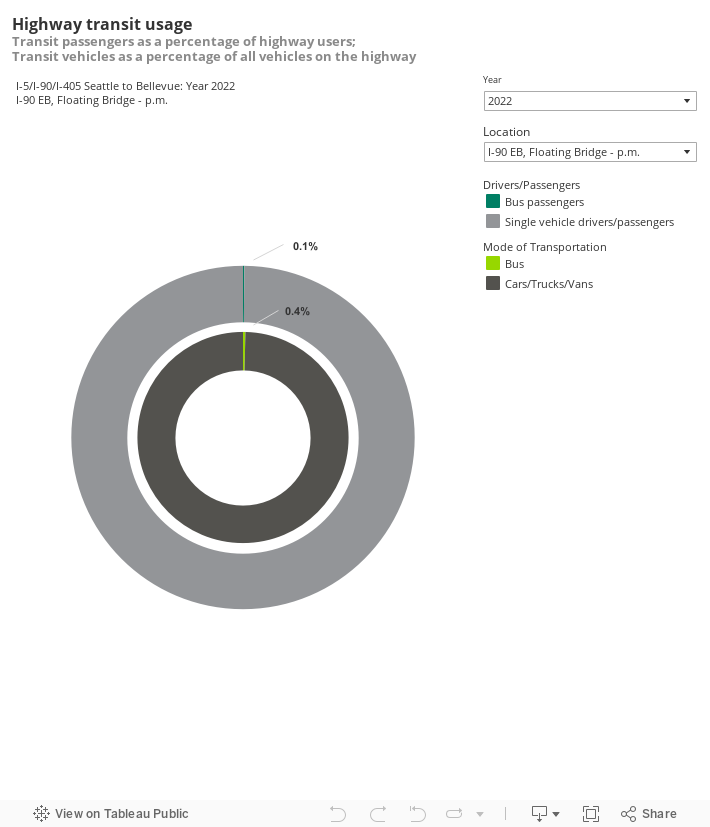
The chart below shows the average percentage of buses compared to all vehicles passing select points on the I-90 corridor in the central Puget Sound region, and the average percentage of bus riders compared to all highway users passing those points.
Source: WSDOT Public Transportation Office.
Note: Charts showing 0.0% may indicate smaller values (for example, 0.04%).
Multi-year trends
Transit ridership remained steady between 2020 and 2022.
In 2020, due to the statewide response to COVID-19 there was reduced demand for transit compared to previous years.
The same trends that impacted delay and travel times on I-90 between 2018 and 2019-economic growth, increased employment, rising housing prices and the opening of the new I-90 HOV lanes on June 1, 2017-also impacted demand for and usage of public transportation on this corridor.
Annual highlights
In 2022, transit ridership did not significantly change compared to 2021. Transit ridership was below the pre-pandemic level. Transit contributed the most to the westbound morning highway commute on I-90 at the floating bridge, where buses (0.4% of all vehicles) moved 0.2% of travelers. During the evening commute at the same location, buses (0.4% of the total vehicles) moved 0.1% of eastbound travelers.
In 2021, transit ridership struggled to recover, compared to 2020, due to the recovery of traffic volume in the wake of COVID-19. However, transit ridership in 2021 wass still not at the pre-pandemic level. Transit contributed the most to morning highway commute travel westbound on I-90 at the floating bridge, where buses (1.3% of all vehicles) moved 0.1% of travelers. During the evening commute at the same location, buses (0.7% of the total vehicles) moved 0.05% of eastbound travelers.
In 2020, due to the statewide response to COVID-19 there reduced demand for transit compared to the previous year. Transit contributed the most to morning highway commute travel westbound on I-90 at the floating bridge, where buses (0.7% of all vehicles) moved 0.9% of travelers. During the evening commute at the same location, buses (0.5% of the total vehicles) moved 0.4% of eastbound travelers.
In 2019, transit contributed the most to morning highway commute travel westbound on I-90 at the floating bridge, where buses (0.9% of all vehicles) moved 19.9% of travelers. During the evening commute at the same location, buses (0.6% of the total vehicles) moved 14.9% of eastbound travelers.
Transit ridership data was not collected for 2018 due to a pause in publication while WSDOT conducted an engagement process to inform the redesign of this dashboard. Following input from its transit agency partners, WSDOT switched from commute-level transit ridership measures to analyzing transit ridership at select locations along urban highway corridors. This change helped to streamline the collaboration process.