Pavement - Remaining Service Life
Performance analysis
2023
Remaining Service Life stays relatively steady
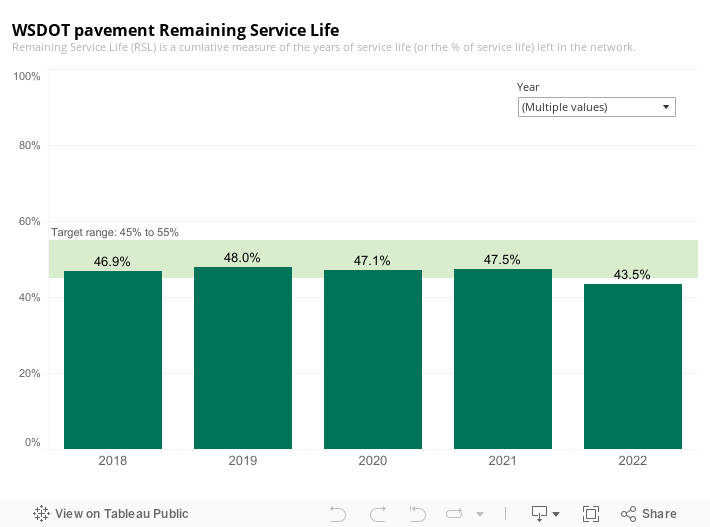
The Remaining Service Life of state-owned pavement increased from 43.5% in 2022 to 44.4% in 2023. The target value is between 45% to 55%.
RSL is a measure of average remaining pavement life summed for each section across the roadway network. It is calculated by first estimating the number of years remaining before the condition of a pavement section is expected to become unacceptable (poor or very poor) and then dividing by the pavement section's total expected lifetime. This number is then averaged over all pavement sections in the network to yield the statewide RSL.
For example, brand-new asphalt pavement on a corridor made to withstand heavy traffic might be expected to last 20 years until it has so many distresses that it is rated poor. If that road was built five years ago, it should have 15 years of service life left. The RSL of this pavement would be the number of years remaining until it is in poor condition (so that is 15 years) divided by the pavement section's total expected lifetime (20 years). The RSL of this pavement is 75%.
If RSL increases over the years, WSDOT has preserved the pavement beyond its expected life. If the RSL decreases over the years, it means that this pavement has deteriorated earlier than expected.
2022
Remaining Service Life increases
The Remaining Service Life of state-owned pavement decreased 4.0 percentage points in 2022, with a value of 43.5%, compared to 47.5% in 2021. The target value is between 45% to 55%. This is the first year in since 2011 that WSDOT has not met the RSL goal.
RSL is a measure of average remaining pavement life summed for each section across the roadway network. It is calculated by first estimating the number of years remaining before the condition of a pavement section is expected to become unacceptable (poor or very poor) and then dividing by the pavement section's total expected lifetime. This number is then averaged over all pavement sections in the network to yield the statewide RSL.
For example, brand-new asphalt pavement on a corridor made to withstand heavy traffic might be expected to last 20 years until it has so many distresses that it is rated poor. If that road was built five years ago, it should have 15 years of service life left. The RSL of this pavement would be the number of years remaining until it is in poor condition (so that is 15 years) divided by the pavement section's total expected lifetime (20 years). The RSL of this pavement is 75%.
If RSL increases over the years, WSDOT has preserved the pavement beyond its expected life. If the RSL decreases over the years, it means that this pavement has deteriorated earlier than expected.
2021
Remaining Service Life increases
The Remaining Service Life of state-owned pavement gained 0.4 percentage points in 2021, with a value of 47.5%, compared to of 47.1% in 2020. The target value is between 45% to 55% and is expected to remain within this range into the future.
RSL is a measure of average remaining pavement life summed for each section across the roadway network. It is calculated by first estimating the number of years remaining before the condition of a pavement section is expected to become unacceptable (poor or very poor) and then dividing by the pavement section's total expected lifetime. This number is then averaged over all of the pavement sections in the network to yield the statewide RSL.
2020
Remaining Service Life declines in 2020
The Remaining Service Life of state-owned pavement dropped 0.9 percentage points in 2020, with a value of 47.1%, compared to of 48.0% in 2019.
RSL is a measure of average remaining pavement life summed for each section across the roadway network. It is calculated by first estimating the number of years remaining before the condition of a pavement section is expected to become unacceptable (poor or very poor) and then dividing by the pavement section's total expected lifetime. This number is then averaged over all of the pavement sections in the network to yield the statewide RSL. The target value is between 45% to 55% and should remain within this range into the future.
2019
Remaining Service Life improves in 2019
Remaining Service Life improves The Remaining Service Life of state-owned pavement increased between 2018 and 2019, going from 46.9% to 48.0%. The RSL remained within WSDOT's target range of 45% to 55%, as it did for all of the five-year period 2015-2019.
RSL indicates how much of its original life span an average section of WSDOT-owned pavement has left before it will need rehabilitation work. In 2019, an average section of WSDOT-owned pavement had 48.0% of its life span—or 7.8 years— remaining before it was expected to need rehabilitation.
The RSL for each section of pavement is calculated by first estimating the number of years remaining before the condition of that section is expected to become unacceptable (poor or very poor), and then dividing by that pavement section's total expected life span. This number is calculated separately for each section of pavement in WSDOT's network, and then averaged to yield the statewide RSL.