Highway maintenance - Level of Service targets
On this page:
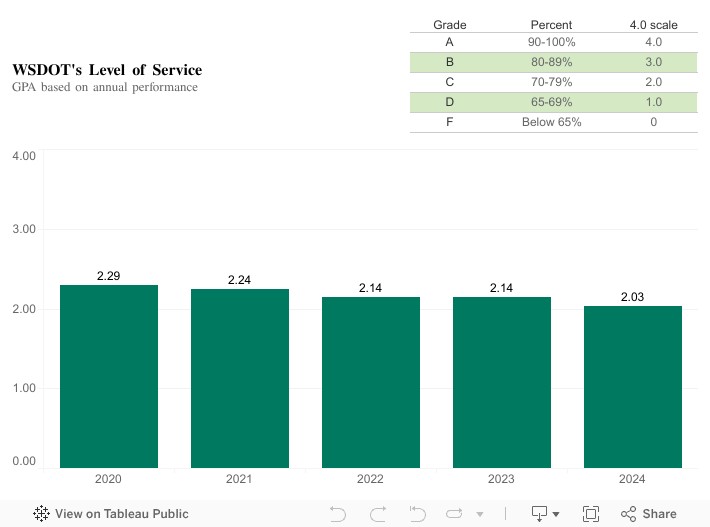
Level of Service targets
Source: WSDOT Maintenance and Operations Office
Note: All facilities in the Urban Tunnel Systems Operations category were under construction during the reporting period, so the category was not included in target calculations for 2018, 2019 or 2020. WSDOT was unable to complete condition assessments for Regulatory/Warning Sign Maintenance and Guide Sign Maintenance due to COVID-19 and carpooling restrictions in 2020.
Level of Service targets by activity
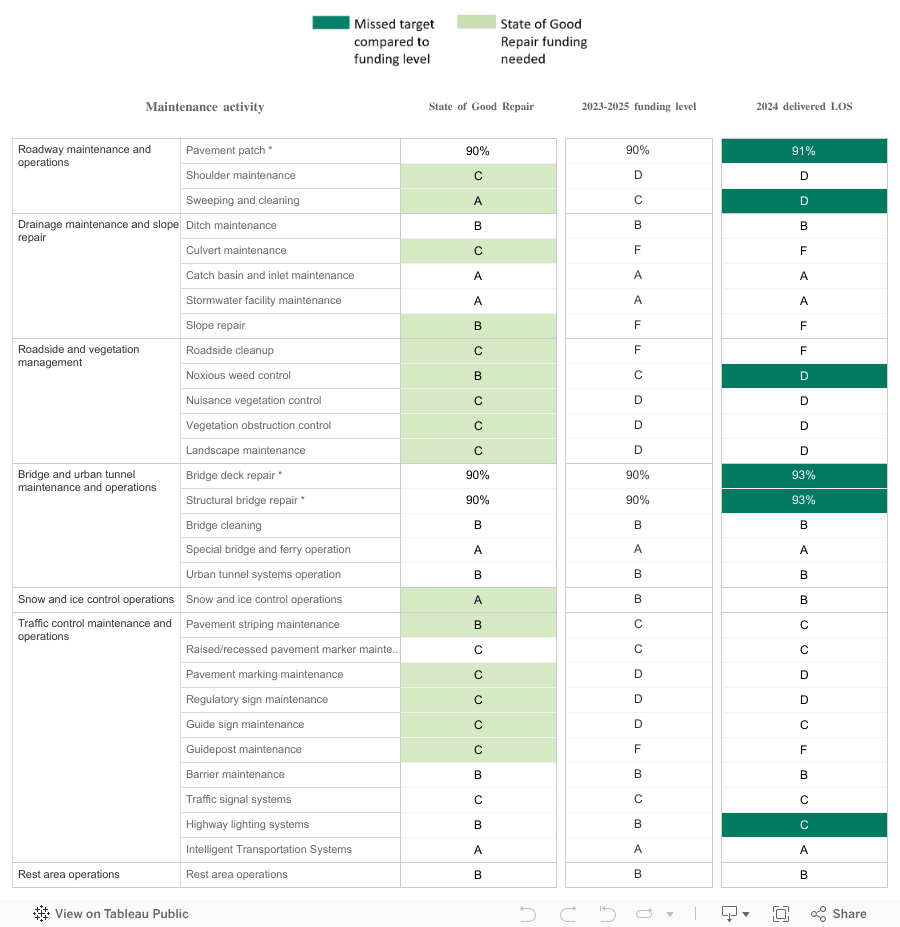
Source: WSDOT Maintenance and Operations Office.
Notes: *Pavement and bridge asset conditions are given as a percentage of WSDOT-owned highway lane miles in fair or better condition (pavement) and as a percentage of WSDOT-owned bridges in fair or better condition by bridge deck area. Pavement data lags one year behind indicated year. Pavement is part of an integrated approach using the Washington State Pavement Management System condition rating, which considers all maintenance and preservation work completed and/or needed. The maintenance activities are listed in prioritized order. Highlighted boxes indicate the target was missed. Level of Service is affected by maintenance activity, rehabilitation/reconstruction of highway infrastructure, third-party damage, disaster events and new construction projects. LOS assessments occur throughout the reporting year, and scores are based on the asset condition at the time of assessment.
Level of Service scores
Asset condition (Level of Service) is one of two metrics WSDOT uses—along with task completion—to determine the performance of its maintenance activities. The Maintenance Accountability Process uses comprehensive planning, measurement, and management to communicate how policy and budget decisions affect program service delivery. WSDOT MAP provides performance-based insight to the condition of assets within WSDOT's transportation system.
The Level of Service performance measure relies on the condition of highway assets as an indicator on how well the maintenance program is being delivered. However, because WSDOT's Preservation and Improvement programs also address the condition of highway assets, the Maintenance Program is only partially responsible for the results of this performance measure.
Level of Service is reported on a scale of "A" through "F," using the same idea as a grade point average, with 4 = an A and 0 = an F. The general definition of each LOS is as follows:
- "A" - The assets are in excellent condition and all systems are operational.
- "B" - The assets are in good condition and all systems are operational.
- "C" - The assets are in fair condition and systems may occasionally be inoperable.
- "D" - The assets are in poor condition and system failures could occur.
- "F" - The assets are in poor and failing condition and system failures are likely.
Performance analysis
2024
WSDOT highway maintenance asset condition level of service scores a low C grade point average
WSDOT's Level of Service for 2024 was 2.03, which equated to a low "C" average. Over the past five years, the GPA has shown a downward trend as longstanding maintenance opeations, facility and preservation funding challenges continue. This GPA, which was still a low C at 2.24 in 2020, has since declined 9.4%. The descending trend mirrors bridge and pavement preservation as asset conditions deteriorate statewide.
2023
WSDOT highway maintenance asset condition level of service scores a 2.14 grade point average
The Maintenance Accountability Process uses comprehensive planning, measuring, and managing to communicate the impacts of policy and budget decisions on program service delivery. Using a variety of comprehensive metrics, the WSDOT MAP provide performance-based insight into the condition of assets within WSDOT's transportation system.
After reviewing the data trends for the past 10 years, WSDOT determined there was a need to display the data in a way that better articulated achievable expectations within the existing budget versus the needs for a State of Good Repair. To aid in the comparison from year to year, starting in 2023 the targets will be reported in a grade point average (GPA) format.
WSDOT's Level of Service for 2023 was a 2.14 which equated to a "C" average. Applying the new LOS reporting standard, the past five years the GPA shows a downward trend as longstanding preservation funding challenges persist throughout the agency.
2022
WSDOT misses 12 of 27 maintenance targets in 2022
Of the 27 maintenance activities measured in 2022, WSDOT missed LOS targets for the following 12 activities:
- Snow and Ice Control Operations
- Regulatory/Warning Sign Maintenance
- Pavement Striping Maintenance
- Culvert Maintenance
- Shoulder Maintenance
- Sweeping and Cleaning
- Slope Repair
- Vegetation Obstruction Control
- Guidepost Maintenance
- Noxious Weed Control
- Roadside Cleanup
- Guide Sign Maintenance
2021
WSDOT misses 12 of 27 maintenance targets in 2021
Of the 27 maintenance activities measured in 2021, WSDOT missed LOS targets for the following 12 activities, which comprised 44% of the total:
- Snow and Ice Control Operations
- Regulatory/Warning Sign Maintenance
- Pavement Striping Maintenance
- Culvert Maintenance
- Shoulder Maintenance
- Sweeping and Cleaning
- Slope Repair
- Pavement Marking Maintenance
- Guidepost Maintenance
- Noxious Weed Control
- Roadside Cleanup
- Guide Sign Maintenance
2020
WSDOT meets 17 of 25 maintenance targets in 2020
WSDOT met 68% (17 of 25) of its highway Maintenance Accountability Process targets for 2020—down nine percentage points from 77% in 2019. WSDOT was unable to complete two of the 27 MAP activities (Regulatory/Warning Sign and Guide Sign Maintenance) due to COVID-19 and carpooling restrictions. The missed targets were primarily due to COVID-19 restrictions, work furloughs, personnel shortages due to hiring freezes and continued budget shortfalls.
Level of Service scores use a letter grading scale, with A being the highest and F being the lowest. Of the 25 maintenance activities measured in 2020, the following activities missed LOS targets:
- Catch Basin and Inlet Maintenance
- Pavement Striping
- Stormwater Facility Maintenance
- Bridge Cleaning
- Sweeping and Cleaning
- Slope Repair
- Noxious Weed Control
- Roadside Cleanup
How WSDOT measures its Level of Service
The GPA grade is based on the annual performance maintenance activities using three metrics:
- Asset condition Level of Service is measured for each asset using data collected from site surveys or operational assessments that evaluate the asset's performance.
- Task completion is an evaluation of planned maintenance tasks for specific activities compared to how many of those tasks were completed.
- Operational performance evaluates how effectively a system, process, or asset performs in fulfilling its intended function under real-world conditions.