Tri-Cities US 395 and SR 240 - Park and rides
On this page:
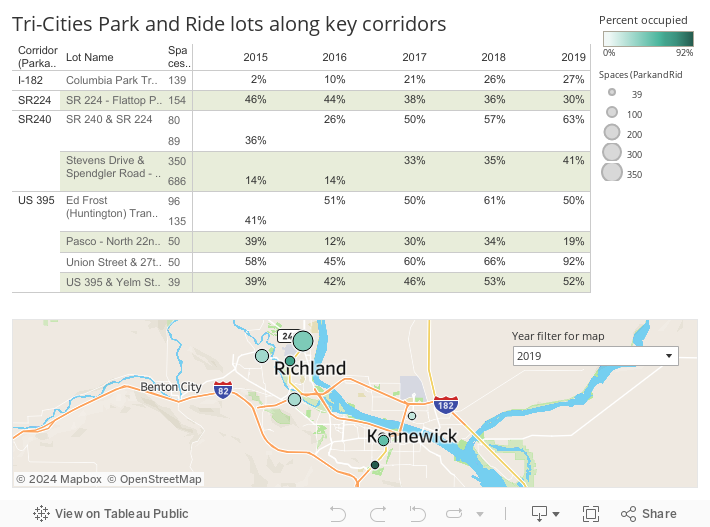
Measures of park and rides along US 395 and SR 240 in the Tri-Cities region.
Park and ride utilization
Park and ride lots provide locations for commuters to meet carpools and vanpools, and catch buses if transit services are not available nears their residences. WSDOT monitors the usage of park and ride lots owned or managed by public agencies, as well as private lots. Refer to Handbook for Corridor Capacity Evaluation (PDF 5.9MB).
Park and ride lots serve a wide variety of commuters, including carpoolers, vanpoolers, transit riders, commuter rail passengers, bicyclists and pedestrians. Park and ride locations are essential for transit riders and carpoolers, and must have high utilization rates to be considered successful. Targeted outreach efforts from transit agencies, as well as employer Commute Trip Reduction initiatives help address highway capacity needs in the Tri-Cities region.
Source: WSDOT Public Transportation Office.
Note: 2020 & 2021 park and rides data not available.
Performance highlights
In 2019, between 19% and 92% of available spaces at park and rides along the I-182, SR 224, SR 240 and US 395 corridors in the Tri-Cities region were filled. The Union Street & 27th Avenue Park and Ride had a 92% utilization rate. One of the eight park and ride lots in this region had utilization rates at or above 85%, which is considered operating at capacity.
In 2018, between 26% and 66% of available spaces at park and rides along the I-182, SR 224, SR 240 and US 395 corridors in the Tri-Cities region were filled. The Union Street & 27th Avenue Park and Ride had a 66% utilization rate. None of the eight park and ride lots in this regionhad utilization rates at or above 85%, which is considered as operating at capacity.
In 2017, between 20% and 60% of available spaces at park and rides along the I-182, SR 224, SR 240 and US 395 corridors in the Tri-Cities region were filled. The Union Street & 27th Avenue Park and Ride had a 60% utilization rate. None of the eight Ppark and ride lots in this regionhad utilization rates at or above 85%, which is considered as operating at capacity.
In 2016, between 30% and 60% of available spaces at park and rides along the I-182, SR 224, SR 240 and US 395 corridors in the Tri-Cities region were filled. None of the eight park and ride lots in this region had a utilization rates at or above 85%, which is considered as operating at capacity.
In 2015, between 40% and 60% of available spaces at park and rides along the US 395 corridor in the Tri-Cities region were filled. None of the four of these park and ride lots had utilization rates at or above 85%, which is considered as operating at capacity.