Tri-Cities US 395 and SR 240 - Dashboard
On this page:
Measures showing Tri-Cities US 395 and SR 240 performance
Indicators
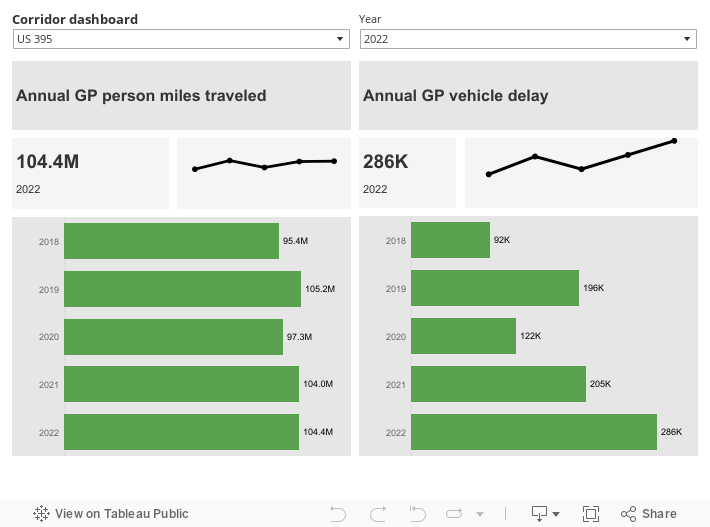
This dashboard shows three multimodal performance indicators for US 395 and SR 240 in the Tri-Cities region:
- Annual general purpose (GP) lane person miles traveled
- Annual GP vehicle delay
For details on methodology to calculate person miles traveled and vehicle delay, refer to WSDOT's Handbook for Corridor Capacity Evaluation (PDF 5.9 MB).
Sources: WSDOT Transportation Safety and Systems Analysis Division and WSDOT TRACFLOW (https://tracflow.wsdot.wa.gov/)
Performance highlights
Annual GP person miles traveled and vehicle delay increased in 2023 compared to 2022 and surpassed pre-pandemic levels. In 2023, there were 108.3 million person miles traveled in the GP lanes on US 395 in the Tri-Cities region, up 3.7% from 104.4 million in 2022. Travelers on this corridor experienced 292,000 hours of vehicle delay in 2023, up 2.1% from 286,000 hours in 2022.
In 2022, annual GP person miles traveled and vehicle delay increased compared to 2021 due to the ongoing recovery of traffic volume in the wake of COVID-19. 104.4 million person miles were traveled in the GP lanes on US 395 in the Tri-Cities region, up 0.4% from 104 million in 2021. Travelers on this corridor experienced 286,000 hours of vehicle delay in 2022, up 40% from 205,000 hours in 2021.
In 2021, annual GP person miles traveled and vehicle delay increased from 2020, due to the recovery of traffic volume in the wake of COVID-19. Nearly 104 million person miles were traveled in the GP lanes on US 395 in the Tri-Cities region, up 7% from 97.3 million person miles in 2020. Travelers on this corridor experienced 205,000 hours of vehicle delay in 2021, up 68% from 122,000 hours in 2020.
In 2020, the statewide response to COVID-19 resulted in a significant reduction in GP person miles traveled and annual delay. Nearly 97.3 million person miles were traveled in the GP lanes on US 395 in the Tri-Cities region, down 7.5% from 105.2 million in 2019. Travelers on this corridor experienced 122,000 hours of vehicle delay in 2020, down 37.8% from 196,000 hours in 2019.
In 2019, nearly 105.2 million person miles were traveled in the GP lanes on US 395 in the Tri-Cities region, up 10.3% from 95.4 million in 2018. Travelers on this corridor experienced 196,000 hours of vehicle delay in 2019, up 113% from 92,000 hours in 2018. Approximately 52% of available parking spaces at Park & Ride lots along this corridor were occupied in 2019, down from 55% in 2018.