Freight - Rail freight
On this page:
Freight measures for rail freight
Rail freight
Rail freight comomodities The types of commodities shipped and the tonnage over years by rail.
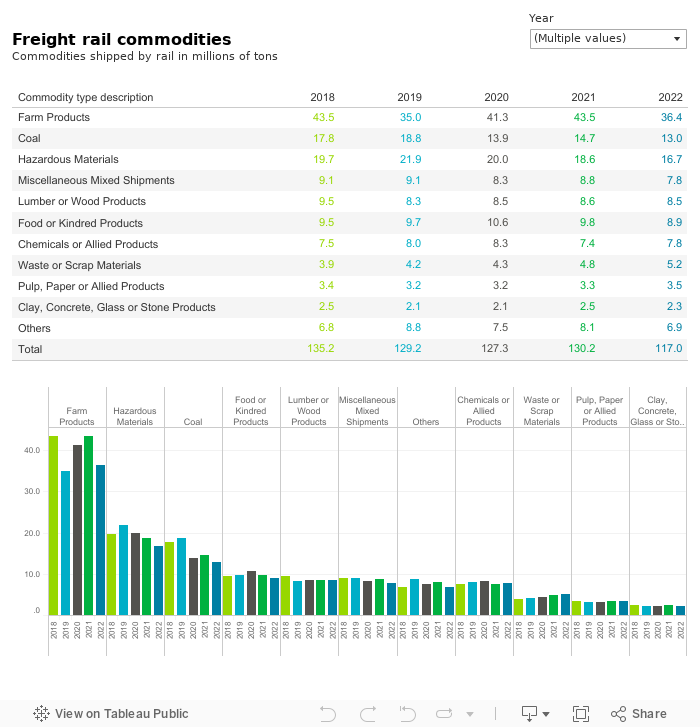
Source: WSDOT Rail, Freight, and Ports Division.
Note: 2023 data not available at the time of publication.
Performance highlights
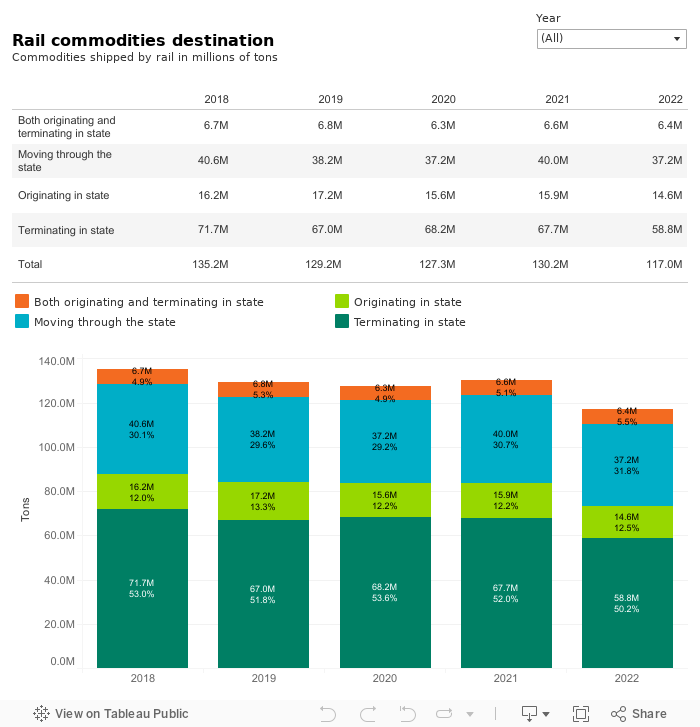
In 2022, railroads in Washington state transported 117.0 million tons of freight, a 10.1% decrease from the 130.2 million tons transported in 2021. The amount of inbound rail freight (freight that originated outside Washington and was transported to a destination within the state) decreased by 13.2% from 67.7 million tons in 2021 to 58.7 million tons in 2022. Inbound freight made up 50.2% of all statewide rail freight in 2022. Freight rail shipments passing through Washington (with both origin and destination outside the state) accounted for 31.8% (37.2 million tons) of total rail freight tonnage, compared to 39.9 million tons in 2021. Approximately 14.6 million tons of outbound rail freight (which had an in-state origin and an out-of-state destination) was transported in Washington state in 2022, making up 12.5% of total freight rail tonnage. The remaining 5.5% (6.4 million tons) of rail freight was intrastate, with both origin and destination inside Washington.
In 2021, railroads in Washington state transported 130.2 million tons of freight, a 2.3% increase from the 127.3 million tons transported in 2020. The amount of inbound rail freight (freight that originated outside Washington and was transported to a destination within the state) decreased by 0.8% from 68.2 million tons in 2020 to 67.7 million tons in 2021. Inbound freight made up 52.0% of all statewide rail freight in 2021. Freight rail shipments passing through Washington (with both origin and destination outside the state) accounted for 30.7% (40.0 million tons) of total rail freight tonnage, compared to 37.2 million tons in 2020. Approximately 15.9 million tons of outbound rail freight (which had an in-state origin and an out-of-state destination) was transported in Washington state in 2021, making up 12.2% of total freight rail tonnage. The remaining 5.1% (6.6 million tons) of rail freight was intrastate, with both origin and destination inside Washington.
In 2020, railroads in Washington state transported 127.3 million tons of freight, a 1.5% decrease from the 129.2 million tons transported in 2019. The overall decrease was driven by significant decreases in corn shipments. The amount of inbound rail freight (freight that originated outside Washington and was transported to a destination within the state) increased by 1.8% from 67.0 million tons in 2019 to 68.2 million tons in 2020. Inbound freight made up 53.8% of all statewide rail freight in 2020. Freight rail shipments passing through Washington (with both origin and destination outside the state) accounted for 29.2% (37.2 million tons) of total rail freight tonnage, compared to 38.2 million tons in 2019. Approximately 15.6 million tons of outbound rail freight (which had an in-state origin and an out-of-state destination) was transported in Washington state in 2020, making up 12.2% of total freight rail tonnage. The remaining 4.9% (6.3 million tons) of rail freight was intrastate, with both origin and destination inside Washington.
In 2019, railroads in Washington state transported 129.2 million tons of freight, a 4.4% decrease from the 135.2 million tons transported in 2018. The overall decrease was driven by significant decreases in corn shipments. The amount of inbound rail freight (freight that originated outside Washington and was transported to a destination within the state) decreased 6.6% from 71.7 million tons in 2018 to 67 million tons in 2019. Inbound freight made up 51.8% of all statewide rail freight in 2019. Freight rail shipments passing through Washington (with both origin and destination outside the state) accounted for 29.6% (38.2 million tons) of total rail freight tonnage, compared to 40.6 million tons in 2018. Approximately 17.2 million tons of outbound rail freight (which had an in-state origin and an out-of-state destination) was transported in Washington state in 2019, making up 13.3% of total freight rail tonnage. The remaining 5.3% (6.8 million tons) of rail freight was intrastate, with both origin and destination inside Washington.
In 2018, railroads in Washington state transported 135 million tons of freight, a 5.4% increase from the 128 million tons transported in 2017. The overall increase was driven by increases in corn shipments and hazardous material shipments. The amount of inbound rail freight (freight that originated outside Washington and was transported to a destination within the state) increased 8.7% from 65.9 million tons in 2017 to 71.7 million tons in 2018. Inbound freight made up 53% of all statewide rail freight in 2018. Freight rail shipments passing through Washington (with both origin and destination outside the state) accounted for 30% (40.6 million tons) of total rail freight tonnage, compared to 39.5 million tons in 2017. Approximately 16.2 million tons of outbound rail freight (which had an in-state origin and an out-of-state destination) was transported in Washington state in 2018, making up 12% of total freight rail tonnage. The remaining 5% (6.7 million tons) of rail freight was intrastate, with both origin and destination inside Washington.