Freight - Marine freight
On this page:
Freight measures for marine freight
Marine freight
Marine freight, also known as waterborne freight indicates the tonnage shipped by destination. Waterborne freight is categorized as foreign, domestic and intrastate (with both origin and destination in Washington).
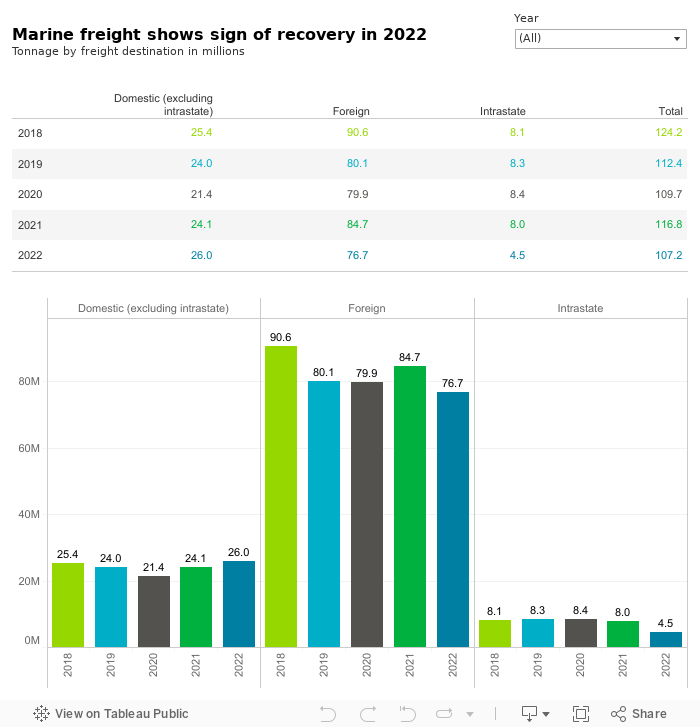
Source: U.S. Army Corps of Engineers, Navigation Data Center.
Note: 2023 data not available at the time of publication.
Performance highlights
Approximately 107.2 million tons of waterborne freight were shipped in Washington in 2022, down 8.2% from 116.8 million tons in 2021. In 2022, 71.6% of waterborne freight was foreign, 24.2% was domestic and 4.2% was intrastate. Foreign freight activity decreased 9.4%—going from 84.7 million tons in 2021 to 76.7 million tons in 2022—Intrastate freight activity fell 43.1% from 8 million tons to 4.5 million tons. Domestic waterborne freight activity increased 7.9% from 24.10 milion tons in 2021 to 26.0 million tons in 2022. The top commodities shipped to, from and within Washington state by water in 2022 included food and food products (such as grain, oilseeds, and other agricultural products) and accounted for 41.2% of commodities. Petroleum products made up 13.4% and crude petroleum comprised 13.8% of shipments. Between 2021 and 2022, the quantities of both petroleum products and crude petroleum shipped increased by 5.8% and 21%, respectively. However, food-related products dropped by 11.5% over the same period.
In 2021, approximately 116.8 million tons of waterborne freight were shipped in Washington, up 6.5% from 109.7 million tons in 2020. In 2021, 72.5% of waterborne freight was foreign, 20.6% was domestic and 6.8% was intrastate. Foreign freight activity increased—going from 79.9 million tons in 2020 to 84.7 million tons in 2021—while both domestic and foreign freight activity increased slightly. At the same time, interstate waterborne freight activity increased slightly. The top commodities shipped to, from and within Washington state by water include food and food products (such as grain, oilseeds and other agricultural products). Petroleum products made up 11.6% and crude petroleum comprised 10.5% of shipments. Between 2020 and 2021, the quantities of petroleum products and crude petroleum shipped decreased by 7.1% and 25.3%, respectively. Food/ kindred products increased by 0.8% over the same period.
In 2020, approximately 109.7 million tons of waterborne freight were shipped in Washington, down 2.4% from 112.4 million tons in 2019. In 2020, 72.8% of waterborne freight was foreign, 19.5% was domestic and 7.7% was intrastate. Foreign freight activity decreased—going from 80.1 million tons in 2019 to 79.9 million tons in 2020—while both domestic and foreign freight activity decreased slightly. At the same time, interstate waterborne freight activity increased slightly. The top commodities shipped to, from and within Washington state by water include food and food products (such as grain, oilseeds and other agricultural products). Petroleum products made up 11.5% and crude petroleum comprised 8.3% of shipments. Between 2019 and 2020, the quantities of petroleum products and crude petroleum shipped decreased by 17.5% and 26.8%, respectively. Food/ kindred products increased by 10.2% over the same period.
In 2019, approximately 112.4 million tons of waterborne freight were shipped in Washington, down 9.5% from 124.2 million tons in 2018. In 2019, 71.3% of waterborne freight was foreign, 21.3% was domestic and 7.4% was intrastate. Foreign freight activity decreased—going from 90.6 million tons in 2018 to 80.1 million tons in 2019—while both domestic and foreign freight activity decreased slightly. The increase in interstate waterborne freight activity. The top commodities shipped to, from and within Washington state by water include food and food products (such as grain, oilseeds and other agricultural products), petroleum products and lumber products. In 2019, food and food products comprised 40.0% of the state's total waterborne freight shipped, petroleum products made up 13.6% and crude petroleum products comprised 11.1%. The quantities of both food/food products and petroleum products shipped decreased from 2018 to 2019 by 11.1% and 1.8%, respectively. Crude petroleum decreased by 9.0% over the same period.
In 2018, approximately 124.2 million tons of waterborne freight were shipped in Washington, up 4.0% from 119.4 million tons in 2017 (2019 statewide figures were not available at the time of publication). In 2018, 72.9% of waterborne freight was foreign, 20.5% was domestic and 6.6% was intrastate. Foreign freight activity increased—going from 84.1 million tons in 2017 to 90.6 million tons in 2018—while both domestic and intrastate freight activity decreased slightly. The increase in foreign waterborne freight activity was due to increases in food exported from Washington as well as increases in crude petroleum and petroleum products imported into the state. The top commodities shipped to, from and within Washington state by water include food and food products (such as grain, oilseeds and other agricultural products), petroleum products and lumber products. In 2018, food and food products comprised 40.7% of the state's total waterborne freight shipped, petroleum products made up 12.5% and lumber products comprised 6.2%. The quantities of both food/food products and petroleum products shipped increased from 2017 to 2018 by 7.9% and 7.8%, respectively. Lumber products decreased by 16.5% over the same period.