Active transportation - Fatalities and serious injuries
On this page:
Measures for active transportation fatalities and serious injuries
Fatalities & serious injuries
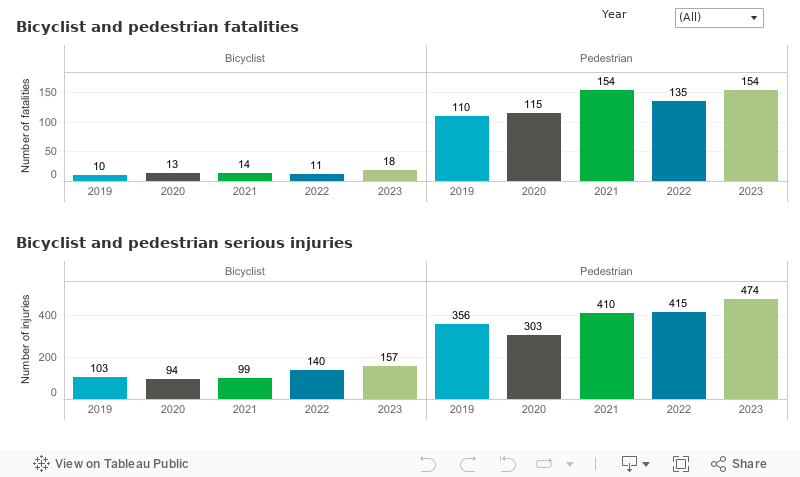
Traffic crashes that result in bicyclist and pedestrian fatalities and serious injuries occur mostly in population centers, at higher posted speeds, and when active transportation users are crossing the road. Traffic fatalities involving pedestrians include people in wheelchairs and those using small rideable devices such as skateboards and scooters.
Source: WSDOT Transportation Data, GIS & Modeling Office
Note: Pedestrians include people in wheelchairs, those using small rideable devices such as skateboards and scooters, and those walking. Some numbers have changed since previous editions of the MMD due to updates within the Coded Fatality Files and WSDOT Engineering Crash Datamart.
Performance highlights
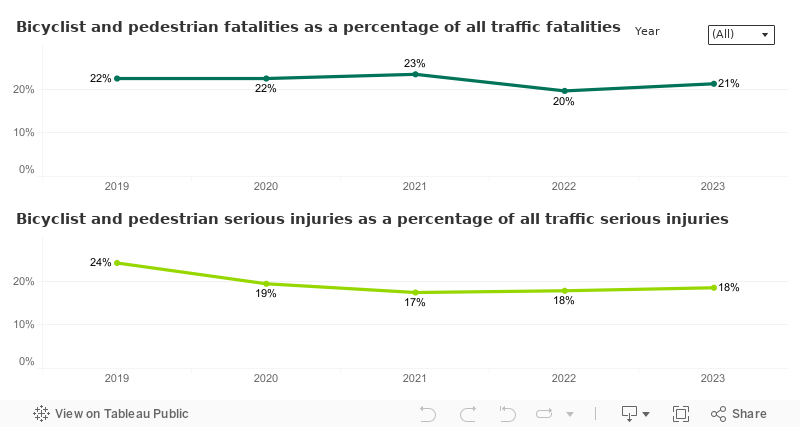
In 2023, the number of bicyclist fatalities increased by seven, totaling 18 fatalities, compared to 11 in 2022. Similarly, pedestrian fatalities rose by 19 individuals, reaching 154 in 2023 from 135 in 2022. Serious injuries sustained by bicyclists in 2023 totaled 157, a 12.1% increase from the 140 in 2022. Likewise, pedestrian serious injuries rose to 474 in 2023, reflecting a 14.2% increase from the 415 in 2022. In 2023, 21% of traffic fatalities were pedestrian and bicyclist, up one percentage point from 20% in 2022. Additionally, the percentage of serious injuries to pedestrians and bicyclists made up 18% of all traffic serious injuries in 2023, the same as 2022.
In 2022, there were 11 bicyclist fatalities, down by three from 14 in 2021. There were 136 pedestrian fatalities in 2022, down by 10 from 146 in 2021. In 2022, there were 142 bicyclist serious injuries, an increase of 43.4% from 99 in 2021. There were 408 pedestrian serious injuries in 2022, a decrease of 0.5% from 410 in 2021. In 2022, 20% of all traffic fatalities were pedestrian and bicyclist fatalities, down three percentage points from 23% in 2021. Pedestrian and bicyclist serious injuries made up 18% of all traffic fatalities in 2022, up from 17% in 2021.
In 2021, there were 14 bicyclist fatalities, up by one from 13 in 2020. There were 146 pedestrian fatalities in 2021, up by 36 from 110 in 2020. In 2021, there were 99 bicyclist serious injuries, an increase of 5.3% from 94 in 2020. There were 410 pedestrian serious injuries in 2021, a increase of 35.3% from 303 in 2020. In 2021, 23% of all traffic fatalities were pedestrian and bicyclist fatalities, up one percentage points from 22% in 2020. Pedestrian and bicyclist serious injuries made up 17% of all traffic fatalities in 2021, down from 19% in 2020.
In 2020, there were 12 bicyclist fatalities, up by three from nine in 2019. There were 105 pedestrian fatalities in 2020, down by two from 107 in 2019. In 2020, there were 95 bicyclist serious injuries, an decrease of 7.8% from 103 in 2019. There were 306 pedestrian serious injuries in 2020, a decrease of 14.5% from 358 in 2019. In 2020, 22% of all traffic fatalities were pedestrian and bicyclist fatalities, same percentage points from 22% in 2019. Pedestrian and bicyclist serious injuries made up 19% of all traffic fatalities in 2020, down from 24% in 2019.
In 2019, there were nine bicyclist fatalities, down by six from 15 in 2018. There were 107 pedestrian fatalities in 2019, up by four from 103 in 2018. In 2019, there were 103 bicyclist serious injuries, an decrease of 15.6% from 122 in 2018. There were 358 pedestrian serious injuries in 2019, a decrease of 10.5% from 400 in 2018. In 2019, 22% of all traffic fatalies were pedestrian and bicyclist fatalities, down two percentage points from 24% in 2018. Pedestrian and bicyclist serious injuries made up 24% of all traffic fatalities in 2019, down from 27% in 2018.