Incident Response - Numbers and clearance times
On this page:
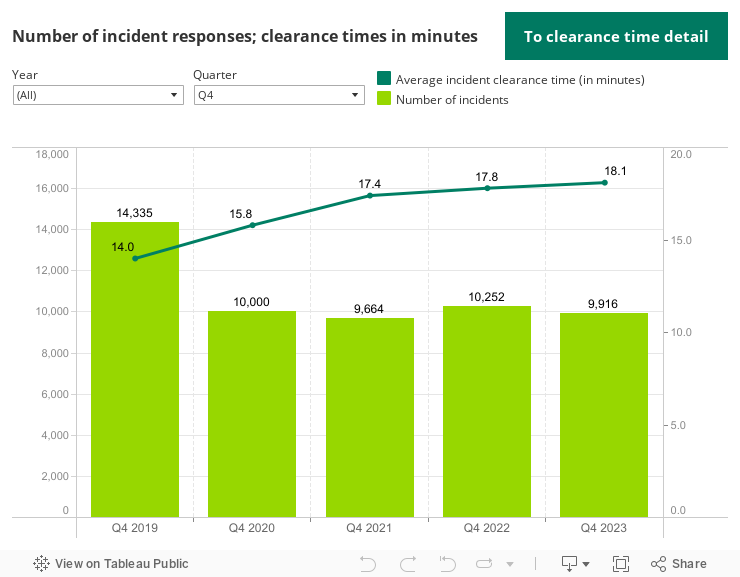
Number of incidents compared to clearance times
WSDOT Incident Response personnel collect data for all incidents to which an IR team responds in the Washington Incident Tracking System. This data includes times of first awareness, arrival on scene, roadway clearance, and incident clearance, which allow WSDOT to analyze various aspects of incident duration. IR teams also record other data such as how they were notified of the incident, incident cause and how many lanes of travel were blocked. Incidents are the total number of events that WSDOT Incident Response teams responded to, including incidents that teams were unable to be located. Incident clearance times are the average time between the first recordable awareness of the incident (detection, notification, or verification) and the time the last responder left the scene. For details on the methodology used to calculate, refer to WSDOT's Handbook for Corridor Capacity Evaluation (PDF 5.9MB).
Source: Washington Incident Tracking System.
Note: For more information on the Incident Response metrics, refer to WSDOT's Handbook for Corridor Capacity Evaluation, 2nd edition, pp. 45-47.
Incident numbers and duration types

Source: Washington Incident Tracking System.
Note: For more information on the Incident Response metrics, refer to WSDOT's Handbook for Corridor Capacity Evaluation, 2nd edition, pp. 45-47.
Performance Analysis
2024 Q4
WSDOT's Incident Response teams assisted at 11,020 incidents during the fourth quarter (October through December) of 2024.
On average, the IR teams responded to an incident scene every 12 minutes and 1 second during the quarter. There were 1,104 (11.1%) more incidents during the fourth quarter of 2024 than in the fourth quarter of 2023 (9,916).
Of the 11,020 total incidents:
- 7,209 (65.4%) lasted less than 15 minutes
- 3,557 (32.3%) lasted 15-90 minutes
- 254 (2.3%) lasted more than 90 minutes
IR teams assisted at the scene of 254 incidents that lasted more than 90 minutes during the fourth quarter of 2024. This was 56 more incidents—a 28.3% increase—than the same quarter in 2023.
2024 Q3
WSDOT's Incident Response teams assisted at 11,841 incidents during the third quarter (July through September) of 2024.
On average, the IR teams responded to an incident scene every 16 minutes and 24 seconds during the quarter. There were 273 (2.4%) more incidents during the third quarter of 2024 than in the third quarter of 2023 (11,568).
Of the 11,841 total incidents:
- 8,232 (69.5%) lasted less than 15 minutes
- 3,387 (28.6%) lasted 15-90 minutes
- 222 (1.9%) lasted more than 90 minutes
IR teams assisted at the scene of 222 incidents that lasted more than 90 minutes during the third quarter of 2024. This was 30 fewer incidents—a 11.9% decrease—than the same quarter in 2023.
2024 Q2
WSDOT's Incident Response teams assisted at 10,323 incidents during the second quarter (April through June) of 2024.
On average, the IR teams responded to an incident scene every 16 minutes and 36 seconds during the quarter. There were 732 (6.6%) fewer incidents during the second quarter of 2024 than in the second quarter of 2023 (11,055).
Of the 10,323 total incidents:
- 7,102 (68.8%) lasted less than 15 minutes
- 3,013 (29.2%) lasted 15-90 minutes
- 208 (2.0%) lasted more than 90 minutes
IR teams assisted at the scene of 208 incidents that lasted more than 90 minutes during the second quarter of 2024. This was four fewer incidents—a 1.9% decrease—than the same quarter in 2023.
2024 Q1
WSDOT's Incident Response teams assisted at 9,997 incidents during the first quarter (January through March) of 2024.
On average, the IR teams responded to an incident scene every 13 minutes and 6 seconds during the quarter. There were 22 (0.2%) fewer incidents during the first quarter of 2024 than in the first quarter of 2023 (10,019).
Of the 9,997 total incidents:
- 6,637 (66.4%) lasted less than 15 minutes
- 3,108 (31.1%) lasted 15-90 minutes
- 252 (2.5%) incidents lasted more than 90 minutes
IR teams assisted at the scene of 252 incidents that lasted more than 90 minutes during the first quarter of 2024. This was 83 more incidents—a 49.1% increase—than the same quarter in 2023.
2023 Q4
WSDOT's Incident Response teams assisted at 9,916 incidents during the fourth quarter (October through December) of 2023.
On average, the IR teams responded to an incident scene every 13 minutes and 22 seconds during the quarter. There were 336 (3.3%) fewer incidents during the fourth quarter of 2023 than in the fourth quarter of 2022 (10,252).
Of the 9,916 total incidents:
- 6,499 (65.5%) lasted less than 15 minutes
- 3,219 (32.5%) lasted 15-90 minutes
- 198 (2.0%) lasted more than 90 minutes
IR teams assisted at the scene of 198 incidents that lasted more than 90 minutes during the fourth quarter of 2023. This was 20 fewer such incidents than the same quarter in 2022—a 9.2% decrease. All the incident duration categories experienced an increased response time during the quarter. As a result, the total average response time took 0.3 minutes longer, increasing from 17.8 minutes in the fourth quarter of 2022 to 18.1 minutes in the same quarter in 2023.
2023 Q3
WSDOT's Incident Response teams assisted at 11,568 incidents during the third quarter (July through September) of 2023.
On average, the IR teams responded to an incident scene every 11 minutes and 27 seconds during the quarter. There were 400 (3.6%) more incidents during the third quarter of 2023 than in the third quarter of 2022 (11,168).
Of the 11,568 total incidents:
- 7,857 (67.9%) lasted less than 15 minutes
- 3,459 (29.9%) lasted 15-90 minutes
- 252 (2.2%) lasted more than 90 minutes
IR teams assisted at the scene of 252 incidents that lasted more than 90 minutes during the third quarter of 2023. This was 39 more such incidents than the same quarter in 2022—an 18.3% increase. All the incident duration categories experienced an increased response time during the quarter. As a result, the total average response time took 1.7 minutes longer, increasing from 15.8 minutes in the third quarter of 2022 to 17.5 minutes in the same quarter in 2023.
2023 Q2
WSDOT's Incident Response teams assisted at 11,055 incidents during the second quarter (April through June) of 2023.
On average, the IR teams responded to an incident scene every 11 minutes and 51 seconds during the quarter. There were 53 (0.5%) fewer incidents during the second quarter of 2023 than in the second quarter of 2022 (11,108).
Of the 11,055 total incidents:
- 7,728 (69.9%) lasted less than 15 minutes
- 3,115 (28.2%) lasted 15-90 minutes
- 212 (1.9%) lasted more than 90 minutes
IR teams assisted at the scene of 212 incidents that lasted more than 90 minutes during the second quarter of 2023. This was 11 more such incidents—a 5.5% increase—than the same quarter in 2022. Also, this quarter had an unusually high number of extraordinary incidents that significantly increased the response time. As a result, it added 1.6 minutes to the total average response time, increasing it from 15.1 minutes in the second quarter of 2022 to 16.7 minutes in the same quarter in 2023.
2023 Q1
WSDOT's Incident Response teams assisted at 10,019 incidents during the first quarter (January through March) of 2023.
On average, the IR teams responded to an incident scene every 12 minutes and 48 seconds during the quarter. There were 267 (2.6%) fewer incidents during the first quarter of 2023 than in the first quarter of 2022 (10,286).
Of the 10,019 total incidents:
- 6,889 (68.8%) lasted less than 15 minutes
- 2,961 (29.6%) lasted 15-90 minutes
- 169 (1.7%) incidents lasted more than 90 minutes
IR teams assisted at the scene of 169 incidents that lasted more than 90 minutes during the first quarter of 2023. This was 27 fewer incidents—a 13.8% decrease—than the same quarter in 2022.
2022 Q4
WSDOT's Incident Response teams assisted at 10,252 incidents during the third quarter (October through December) of 2022.
This averages to IR teams responding to an incident scene every 12 minutes and 55 seconds during the quarter. There were 588 (6.1%) more incidents during the third quarter of 2022 compared to the same quarter in 2021 (9,664).
Of the 10,252 total incidents:
- 6,794 (66.3%) lasted less than 15 minutes
- 3,240 (31.6%) lasted 15-90 minutes
- 218 (2.1%) incidents lasted more than 90 minutes
IR teams provided assistance at the scene of 218 incidents that lasted more than 90 minutes during the third quarter of 2022. This was six fewer incidents—a 2.1% decrease—than the same quarter in 2021.
2022 Q3
WSDOT's Incident Response teams assisted at 11,168 incidents during the third quarter (July through September) of 2022.
This averages to IR teams responding to an incident scene every 11 minutes and 52 seconds during the quarter. There were 738 (6.2%) fewer incidents during the third quarter of 2022 compared to the same quarter in 2021 (11,906).
Of the 11,168 total incidents:
- 7,930 (71.0%) lasted less than 15 minutes
- 3,025 (27.1%) lasted 15-90 minutes
- 213 (1.9%) incidents lasted more than 90 minutes
IR teams provided assistance at the scene of 213 incidents that lasted more than 90 minutes during the third quarter of 2022. This was 10 fewer incidents—a 4.5% decrease—than the same quarter in 2021.
2022 Q2
WSDOT's Incident Response teams assisted at 11,108 incidents during the second quarter (April through June) of 2022.
On average, the IR teams responded to an incident scene every 11 minutes and 48 seconds during the quarter. There were 851 (7.1%) fewer incidents during the second quarter of 2022 than in the same quarter of 2021 (11,959).
Of the 11,108 total incidents:
- 7,985 (71.9%) lasted less than 15 minutes
- 2,922 (26.4%) lasted 15-90 minutes
- 201 (1.6%) incidents lasted more than 90 minutes
IR teams assisted at the scene of 201 incidents that lasted more than 90 minutes during the second quarter of 2022. This was eight more incidents—a 4.1% increase—compared to the same quarter in 2021.
2022 Q1
WSDOT's Incident Response teams assisted at 10,286 incidents during the first quarter (January through March) of 2022.
On average, the IR teams responded to an incident scene every 12 minutes and 28 seconds during the quarter. There were 682 (6.2%) fewer incidents during the first quarter of 2022 than in the first quarter of 2021 (10,968).
Of the 10,286 total incidents:
- 7,297 (70.9%) lasted less than 15 minutes
- 2,793 (27.2%) lasted 15-90 minutes
- 196 (1.9%) incidents lasted more than 90 minutes
IR teams assisted at the scene of 196 incidents that lasted more than 90 minutes during the first quarter of 2022. This was 15 fewer incidents—a 7.1% decrease—than the same quarter in 2021.
2021 Q4
Statewide travel continued to decrease in response to COVID-19 and as a result incident response teams assisted at 9,664 incidents, which was 336 (3.4%) fewer than the same quarter in 2020 (10,000).
On average, IR teams cleared each of the 9,664 incidents in 17 minutes and 24 seconds, which is one minute and 36 seconds (10.1%) slower than the average incident clearance time in the same quarter in 2020.
Of the 9,664 total incidents:
- 6,603 (68.3%) lasted less than 15 minutes
- 2,837 (29.4%) lasted 15-90 minutes
- 224 (2.3%) incidents lasted more than 90 minutes
There was a 29.5% increase in incidents lasting more than 90 minutes compared to the same quarter in 2020, while there were 2.3% more incidents lasting 15-90 minutes and 6.4% fewer incidents lasting less than 15 minutes.
2021 Q3
Statewide travel continued to decrease in response to COVID-19 and as a result incident response teams assisted at 11,906 incidents, which was 652 (5.8%) fewer than the same quarter in 2020 (11,254).
On average, IR teams cleared each of the 11,906 incidents in 16 minutes, which is one minute and 24 seconds (9.6%) slower than the average incident clearance time in the same quarter in 2020.
Of the 11,906 total incidents:
- 8,364 (70.3%) lasted less than 15 minutes
- 3,319 (27.9%) lasted 15-90 minutes
- 223 (1.9%) incidents lasted more than 90 minutes
There was a 8.8% increase in incidents lasting more than 90 minutes compared to the same quarter in 2020, while there were 21.6% more incidents lasting 15-90 minutes and 0.5% more incidents lasting less than 15 minutes.
2021 Q2
Statewide travel continued to decrease in response to COVID-19 and as a result incident response teams assisted at 11,959 incidents, which was 1,603 (15.5%) more than the same quarter in 2020 (10,356).
On average, IR teams cleared each of the 11,959 incidents in 15 minutes and 6 seconds, which is one minute and 42 seconds (12.7%) slower than the average incident clearance time in the same quarter in 2020.
Of the 11,959 total incidents:
- 8,604 (71.9%) lasted less than 15 minutes
- 3,162 (26.4%) lasted 15-90 minutes
- 193 (1.6%) incidents lasted more than 90 minutes
There was a 18.4% increase in incidents lasting more than 90 minutes compared to the same quarter in 2020, while there were 42.9% more incidents lasting 15-90 minutes and 7.8% more incidents lasting less than 15 minutes.
2021 Q1
Statewide travel continued to decrease in response to COVID-19 and as a result incident response teams assisted at 10,968 incidents, which was 2,200 (16.7%) more than the same quarter in 2020 (13,168).
On average, IR teams cleared each of the 10,968 incidents in 15 minutes and 48 seconds, which is two minute and 18 seconds (17.0%) slower than the average incident clearance time in the same quarter in 2020.
Of the 10,968 total incidents:
- 7,813 (71.2%) lasted less than 15 minutes
- 2,944 (26.8%) lasted 15-90 minutes
- 211 (1.9%) incidents lasted more than 90 minutes
There was a 24.1% increase in incidents lasting more than 90 minutes compared to the same quarter in 2020, while there were 9.9% fewer incidents lasting 15-90 minutes and 19.7% fewer incidents lasting less than 15 minutes.
2020 Q4
Statewide travel continued to decrease in response to COVID-19 and as a result incident response teams assisted at 10,000 incidents, which was 4,335 (30.2%) fewer than the same quarter in 2019 (14,335).
On average, IR teams cleared each of the 10,000 incidents in 15 minutes and 48 seconds, which is one minute and 48 seconds(12.9%) slower than the average incident clearance time in the same quarter in 2019.
Of the 10,000 total incidents:
- 7,055 (70.6%) lasted less than 15 minutes
- 2,772 (27.7%) lasted 15-90 minutes
- 173 (1.7%) incidents lasted more than 90 minutes
There was a 4.8% decrease in incidents lasting more than 90 minutes compared to the same quarter in 2019, while there were 22.7% fewer incidents lasting 15-90 minutes and 33.4% fewer incidents lasting less than 15 minutes.
2020 Q3
Statewide travel continued to decrease in response to COVID-19 and as a result incident response teams assisted at 11,254 incidents, which was 4,537 (28.7%) fewer than the same quarter in 2019 (15,791).
On average, IR teams cleared each of the 11,254 incidents in 14 minutes and 36 seconds, which is one minute and 18 seconds(9.8%) slower than the average incident clearance time in the same quarter in 2019.
Of the 11,254 total incidents:
- 8,320 (73.9%) lasted less than 15 minutes
- 2,729 (24.2%) lasted 15-90 minutes
- 205 (1.8%) incidents lasted more than 90 minutes
There was a 3.8% decrease in incidents lasting more than 90 minutes compared to the same quarter in 2019, while there were 28.1% fewer incidents lasting 15-90 minutes and 29.4% fewer incidents lasting less than 15 minutes.
2020 Q2
Statewide travel continued to decrease in response to COVID-19 and as a result incident response teams assisted at 10,356 incidents, which was 5,912 (36.3%) fewer than the same quarter in 2019 (16,268).
On average, IR teams cleared each of the 10,356 incidents in 13 minutes and 24 seconds, which is one minute and six seconds (8.9%) slower than the average incident clearance time in the same quarter in 2019.
Of the 10,356 total incidents:
- 7,980 (77.1%) lasted less than 15 minutes
- 2,213 (21.4%) lasted 15-90 minutes
- 163 (1.6%) incidents lasted more than 90 minutes
There was a 9.9% increase in incidents lasting more than 90 minutes compared to the same quarter in 2019, while there were 38.8% fewer incidents lasting 15-90 minutes and 36% fewer incidents lasting less than 15 minutes.
2020 Q1
Statewide travel continued to decrease in response to COVID-19 and as a result incident response teams assisted at 13,168 incidents, which was 3,842 (22.6%) fewer than the same quarter in 2019 (17,010).
On average, IR teams cleared each of the 13,168 incidents in 13 minutes and 30 seconds, which is one minute (8.0%) slower than the average incident clearance time in the same quarter in 2019.
Of the 13,168 total incidents:
- 9,729 (73.9%) lasted less than 15 minutes
- 3,269 (24.8%) lasted 15-90 minutes
- 170 (1.3%) incidents lasted more than 90 minutes
There was a 10.5% decrease in incidents lasting more than 90 minutes compared to the same quarter in 2019, while there were 14.1% fewer incidents lasting 15-90 minutes and 25.3% fewer incidents lasting less than 15 minutes.