Vancouver region State Route 500 - Dashboard
On this page:
Performance indicators for SR 500 in the Vancouver region
Indicators
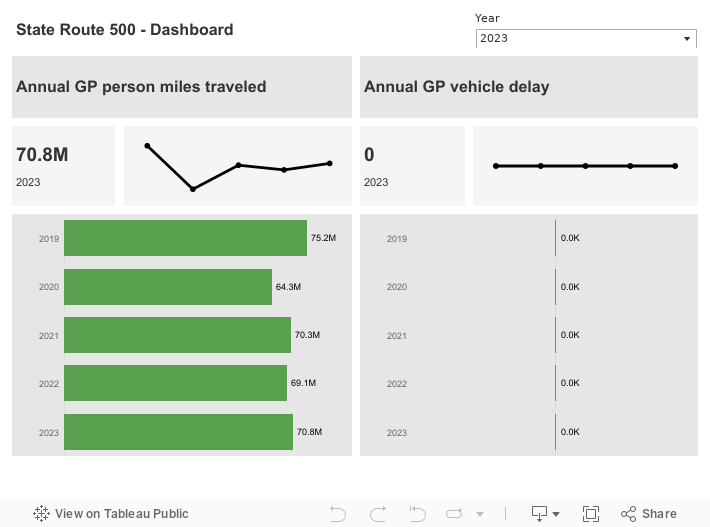
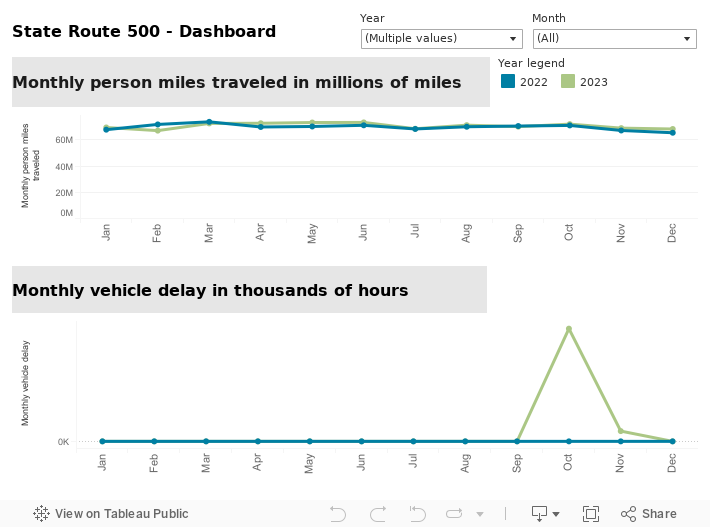
This dashboard shows two multimodal performance indicators for State Route 500 in the Vancouver region:
- Annual general purpose (GP) lane person miles traveled
- Annual GP vehicle delay
For details on methodology to calculate person miles traveled and vehicle delay, refer to WSDOT's
Handbook for Corridor Capacity Evaluation (PDF 5.9MB).
Sources: WSDOT Transportation Safety and Systems Analysis Division and WSDOT TRACFLOW (https://tracflow.wsdot.wa.gov/)
Performance highlights
Nearly 70.8 million person miles were traveled in the GP lanes on SR 500 between the I-5 interchange and I-205, a 2.5% increase from 69.1 million in 2022.
Travelers on this corridor experienced no vehicle delay in 2023.
Nearly 69.1 million person miles were traveled in the GP lanes on SR 500 between the I-5 interchange and I-205, down 1.7% from 70.3 million in 2021.
Travelers on this corridor experienced no vehicle delay in 2022.
Annual person miles traveled were lower than the pre-pandemic levels from 2019. Nearly 70.3 million person miles were traveled on SR 500 between the I-5 interchange and I-205, up 9.3% from 64.3 million in 2020.
Travelers on this corridor experienced no vehicle delay in 2021.
Annual person miles traveled were lower than the pre-pandemic levels from 2019. Nearly 64.3 million person miles were traveled on SR 500 between the I-5 interchange and I-205, down 14.5% from 75.2 million in 2019.
Travelers on this corridor experienced no vehicle delay in 2020.
In 2019, nearly 75.2 million person miles were traveled on SR 500 between the I-5 interchange and I-205.
Travelers on this corridor experienced no vehicle delay in 2019.