Vancouver region State Route 14 - Dashboard
On this page:
Performance indicators for SR 14 in the Vancouver region
Indicators
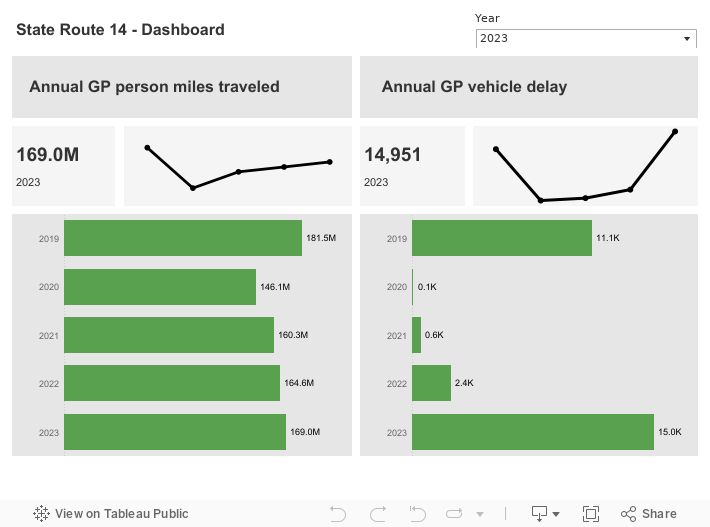
This dashboard shows two multimodal performance indicators for State Route 14 in the Vancouver region:
- Annual general purpose (GP) lane person miles traveled
- Annual GP vehicle delay
For details on methodology to calculate person miles traveled and vehicle delay, refer to WSDOT's Handbook for Corridor Capacity Evaluation (PDF 5.9MB).
Sources: WSDOT Transportation Safety and Systems Analysis Division and WSDOT TRACFLOW (https://tracflow.wsdot.wa.gov/)
Performance highlights
More than 169 million person miles were traveled in the GP lanes on SR 14 between the I-5 interchange and Camas, a 2.7% increase from 164.6 million in 2022.
Travelers on this corridor experienced 15,000 hours of vehicle delay in 2023, which surpassed pre-pandemic levels and marked a 525% increase from the 2,400 hours in 2022.
In 2022, annual person miles traveled and vehicle delay increased from 2021 due to the ongoing recovery of traffic volume in the wake of COVID-19. Annual person miles traveled were slightly lower than the pre-pandemic level but vehicle delay significantly lower than the pre-pandemic level. Nearly 164.6 million person miles were traveled on SR 14 between the I-5 interchange and Camas, up 2.7% from 160.3 million in 2021. Travelers on this corridor experienced 2,400 hours of vehicle delay in 2022, up 300% from the 600 hours in 2021.
In 2021, annual person miles traveled and vehicle delay increased from 2020, due to the recovery of traffic volume in the wake of COVID-19. Nearly 160.3 million person miles were traveled on SR 14 between the I-5 interchange and Camas, up 9.7% from 146.1 million in 2020. Travelers on this corridor experienced 600 hours of vehicle delay in 2021, up over 500% from 100 hours in 2020.
In 2020, the statewide response to COVID-19 resulted in a significant reduction in person miles traveled and annual delay. Nearly 146.1 million person miles were traveled on SR 14 between the I-5 interchange and Camas, down 20% from 181.5 million in 2019. Travelers on this corridor experienced 100 hours of vehicle delay in 2020, down just over 99% from 11,100 in 2019.
In 2019, nearly 181.5 million person miles were traveled on SR 14 between the I-5 interchange and Camas, down 0.2% from 181.6 million in 2018. Travelers on this corridor experienced 11,100 hours of vehicle delay in 2019, up about 330% from 2,600 in 2018.