Spokane region Interstate 90 - Dashboard
On this page:
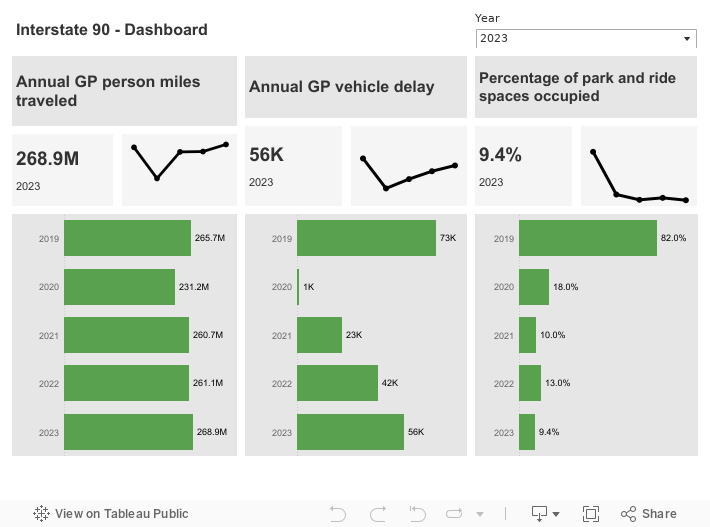
Performance indicators for I-90 in the Spokane region
Indicators
This dashboard shows three multimodal performance indicators for Interstate 90 in the Spokane region:
- Annual general purpose (GP) lane person miles traveled
- Annual GP vehicle delay
- Percentage of park and ride spaces occupied.
For details on methodology to calculate person miles traveled and vehicle delay, refer to WSDOT's Handbook for Corridor Capacity Evaluation (PDF 5.9 MB).
Sources: WSDOT Transportation Safety and Systems Analysis Division and WSDOT TRACFLOW (https://tracflow.wsdot.wa.gov/)
Performance highlights
In 2023, GP person miles traveled and annual delay increased from 2022 due to ongoing recovery of traffic volumes in the wake of COVID-19. Nearly 268.9 million person miles were traveled in the GP lanes on I-90 between Division and Argonne Road, up 3.0% from 261.1 million in 2022. Travelers on this corridor experienced 56,000 hours of vehicle delay in 2023, up 33.3% from 42,000 hours in 2022. Also, 9.4% of available parking spaces at park and ride lots along this corridor were occupied in 2023, down from 13% in 2022.
In 2022, GP person miles traveled and annual delay increased from 2021 due to ongoing recovery of traffic volumes in the wake of COVID-19. Nearly 261.1 million person miles were traveled in the GP lanes on I-90 between Division and Argonne Road, up 0.2% from 260.7 million in 2021. Travelers on this corridor experienced 42,000 hours of vehicle delay in 2022, up 83% from 23,000 hours in 2021. Also, 13% of available parking spaces at park and ride lots along this corridor were occupied in 2022, up from 10% in 2021.
In 2021, annual GP person miles traveled and vehicle delay increased from 2020, due to the recovery of traffic volume in the wake of COVID-19. Nearly 260.7 million person miles traveled in the GP lanes on I-90 between Division and Argonne Road, up 12.8% from 231.2 million in 2020. Travelers on this corridor experienced 23,000 hours of vehicle delay in 2021, up 22,000 hours than 1,00 hours in 2020. 10% of available parking spaces at park and ride lots along this corridor were occupied in 2021, down from 18% in 2020.
In 2020, the statewide response to COVID-19 resulted in a significant reduction in GP person miles traveled and annual delay. Nearly 231.2 million person miles were traveled in the GP lanes on I-90 between Division Street and Argonne Road, down 13.0% from 265.7 million in 2019. Travelers on this corridor experienced 1,000 hours of vehicle delay in 2020, down 98.6% from 73,000 in 2019. Approximately 18% of available parking spaces at park and ride lots along this corridor were occupied in 2020, down from 82% in 2019.
In 2019, about 265.7 million person miles were traveled in the GP lanes on I-90 between Division Street and Argonne Road, up 3.5% from 256.8 million in 2018. Travelers on this corridor experienced 73,000 hours of vehicle delay in 2019, up 40.4% from 52,000 in 2018. Approximately 83.7% of available parking spaces at Park & Ride lots along this corridor were occupied in 2019, up from 74.7% in 2018.