South Puget Sound Interstate 5 - Transit ridership
On this page:
Transit ridership (transit share of passengers and vehicles)
Transit ridership
WSDOT works with transit agencies in major urban areas throughout the state to collect data on the number of transit vehicles and passengers that pass specific points on select urban highway corridors, including the I-5 corridor in the south Puget Sound region between Olympia and Federal Way. WSDOT combines this data with its highway vehicle and person throughput data to produce the measures below. For more information on how WSDOT calculates vehicle and person throughput, refer to WSDOT's Handbook for Corridor Capacity Evaluation (PDF 5.9MB).
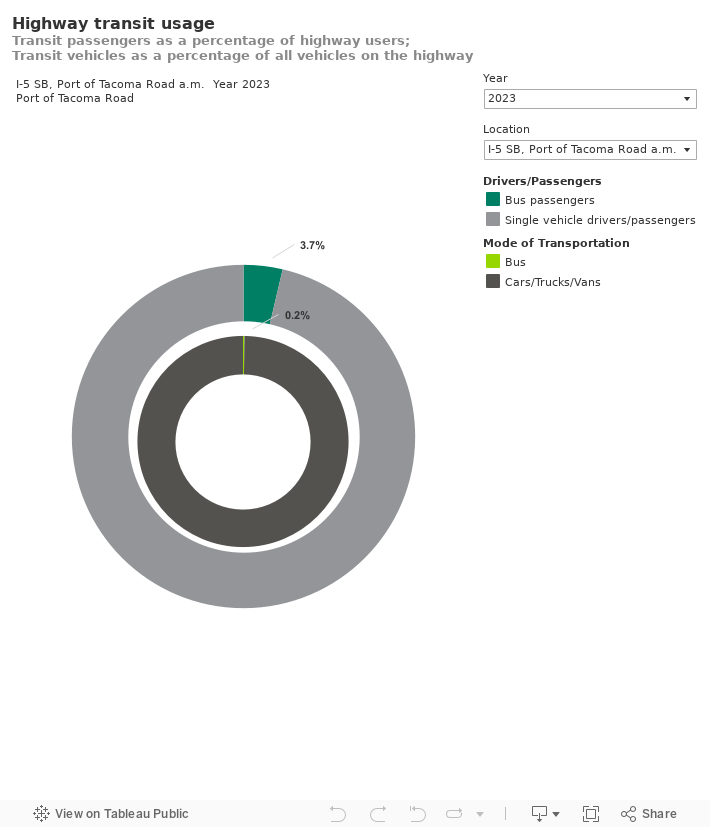
The chart below shows the average percentage of buses compared to all vehicles passing select points on I-5 in the south Puget Sound region and the average percentage of bus riders compared to all highway users passing those points. Use the drop-down menus in the chart to determine how these percentages vary by location, time of day and direction of travel.
Source: WSDOT Public Transportation Office.
Note: Charts showing 0.0% may indicate smaller values (for example, 0.04%).
Performance highlights
In 2023, transit ridership continued to increase due to the ongoing recovery of travel volumes and travel demand in the wake of COVID-19, but was still below pre-pandemic levels.
Transit contributed the most to morning highway commute travel southbound on I-5 at Port of Tacoma Road, where buses (0.2% of all vehicles) moved 3.7% of travelers.
During the evening commute at the same location, buses (0.2% of all vehicles) moved 1.8% of the northbound travelers.
In 2022, transit ridership percentage slightly increased compared to 2021. Transit contributed the most to morning highway commute travel southbound on I-5 at Port of Tacoma Road, where buses (0.2% of all vehicles) moved 3.2% of travelers. During the evening commute at the same location, buses (0.2% of all vehicles) moved 1.3% of the northbound travelers.
In 2021, transit ridership percentage increased compared to 2020. Transit contributed the most to morning highway commute travel southbound on I-5 at Port of Tacoma Road, where buses (3.2% of all vehicles) moved 3.2% of travelers. During the evening commute at the same location, buses (1.1% of all vehicles) moved 1.1% of the northbound travelers.
In 2020, due to the statewide response to COVID-19 there was a significant decrease in transit ridership compared to the previous year. Transit routes were temporarily suspended part of this year, and some numbers have not been reported. Transit contributed the most to morning highway commute travel southbound on I-5 at Port of Tacoma Road, where buses (0.3% of all vehicles) moved 2.0% of travelers. During the evening commute at the same location, buses (0.4% of all vehicles) moved .9% of the northbound travelers.
In 2019, transit contributed the most to morning highway commute travel southbound on I-5 at Port of Tacoma Road, where buses (0.3% of all vehicles) moved 7.2% of travelers. During the evening commute at the same location, buses (0.4% of all vehicles) moved 9.4% of the northbound travelers.