Central Puget Sound Interstate 405 - Transit ridership
On this page:
Measures of transit on I-405 in the central Puget Sound region
Transit ridership
WSDOT works with transit agencies in major urban areas throughout the state to collect data on the number of transit vehicles and passengers that pass specific points on select urban highway corridors, including I-405 in the central Puget Sound region. WSDOT combines this data with its highway vehicle and person throughput data to produce the measures below. For more information on how WSDOT calculates vehicle and person throughput, refer to WSDOT's Handbook for Corridor Capacity Evaluation (PDF 5.9MB).
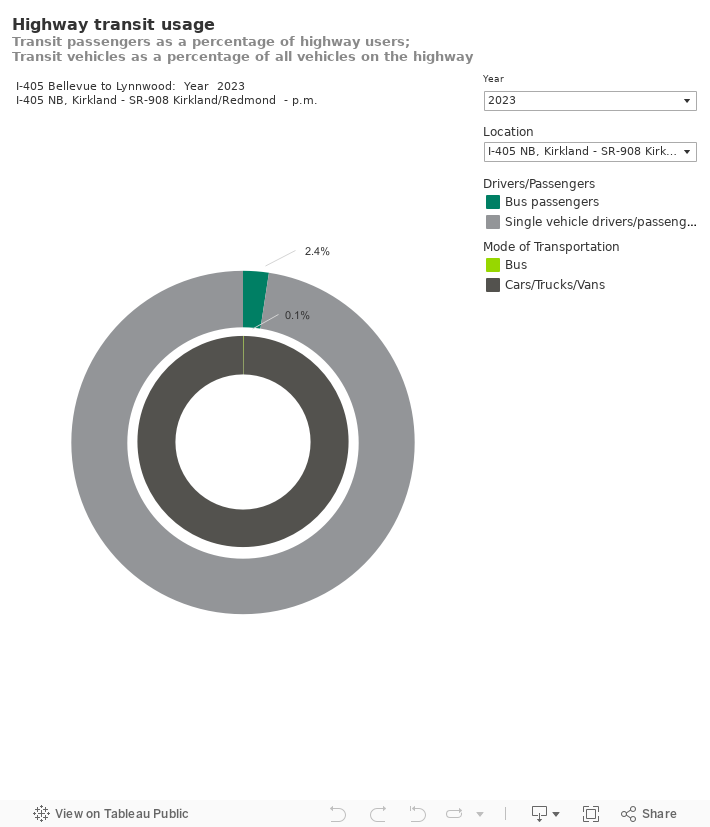
The chart below shows the average percentage of buses compared to all vehicles passing select points on I-405 in the central Puget Sound region, and the average percentage of bus riders compared to all highway users passing those points. Use the drop-down menus in the chart to see how these percentages vary by location, time of day, direction of travel and year.
Source: WSDOT Public Transportation Division.
Note: Charts showing 0.0% may indicate smaller values (for example, 0.04%).
Performance highlights
In 2023, transit ridership increased slightly compared to 2022. Transit contributed the most to the morning highway commute southbound on I-405 at Kirkland, where buses (0.1% of all vehicles) moved 3.5% of travelers. During the evening commute at the same location, buses (0.1% of the total vehicles) moved 2.4% of the northbound travelers.
In 2022, transit ridership was similar to 2021. Transit contributed the most to the morning highway commute southbound on I-405 at Kirkland, where buses (0.1% of all vehicles) moved 1.3% of travelers. During the evening commute at the same location, buses (0.03% of the total vehicles) moved 0.2% of the northbound travelers.
In 2021, there were slight number of increase and decrease in transit ridership compare to previous year, but the number of transit riderships was still under the pre-pandemic level. Transit contributed the most to the morning highway commute southbound on I-405 at Kirkland, where buses (0.3% of all vehicles) moved 1.1% of travelers. During the evening commute at the same location, buses (0.1% of the total vehicles) moved 0.2% of the northbound travelers.
In 2020, due to the statewide response to COVID-19 there was significant decrease in demand for public transportation compared to previous year. Transit contributed the most to morning highway commute travel southbound on I-405 at Kirkland, where buses (0.3% of all vehicles) moved 0.8% of travelers. During the evening commute at the same location, buses (0.1% of the total vehicles) moved 5% of the northbound travelers.