Central Puget Sound Interstate 405 - Dashboard
On this page:
Performance indicators for I-405 in the central Puget Sound region.
Indicators
This dashboard shows three multimodal performance indicators for Interstate 405 in the central Puget Sound region:
- Annual general purpose (GP) lane person miles traveled
- Annual GP vehicle delay
- Percentage of park and ride spaces occupied
For details on the methodology used to calculate person miles traveled and vehicle delay, refer to WSDOT's Handbook for Corridor Capacity Evaluation (PDF 5.9MB).
Sources: WSDOT Transportation Safety and Systems Analysis Division and WSDOT TRACFLOW (https://tracflow.wsdot.wa.gov/)
Performance highlights
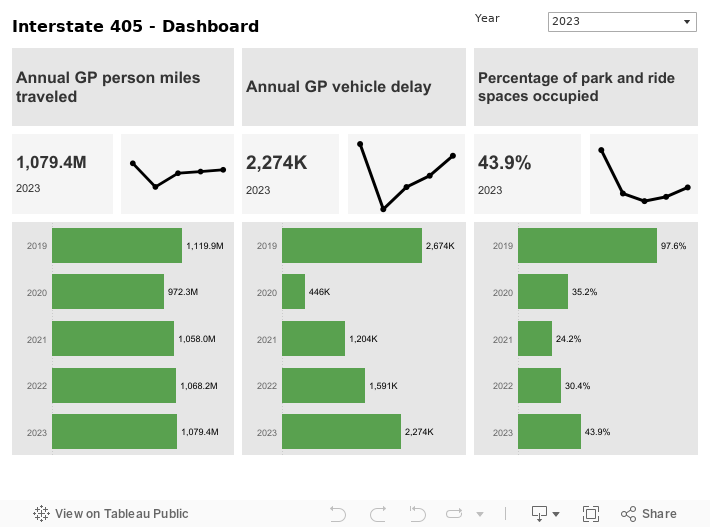
Annual GP person miles traveled and vehicle delay both increased in 2023. Annual GP person miles traveled on I-405 between Tukwila and Lynnwood almost reached pre-COVID-19 pandemic levels in 2023 and was 1.08 billion, up 1% from 1.07 billion in 2022. Travelers on this corridor experienced 2.3 million hours of vehicle delay in 2023, up 43% from 1.6 million hours in 2022.
In 2022, annual GP person miles traveled and vehicle delay increased due to the ongoing recovery of traffic volume in the wake of COVID-19. Annual GP
person miles traveled in 2022 was 1.07 billion on I-405, between Tukwila and Lynnwood, up 1% from 1.06 billion in 2021. Travelers on this corridor experienced 1.6 million hours of vehicle delay in 2022, up 32% from 1.2 million hours in 2021.
In 2021, annual GP person miles traveled and vehicle delay increased from 2020, due to the recovery of traffic volume in the wake of COVID-19. Annual GP
person miles traveled in 2021 was 1.1 billion on I-405, between Tukwila and Lynnwood, up 9% from 972 million in 2020. Travelers on this corridor experienced 1.2 million hours of vehicle delay in 2021, up 170% from 0.4 million hours in 2020.
In 2020, due to the statewide response to COVID-19 there was significant reduction in GP person miles traveled and annual delay compared to the previous year. Annual GP person miles traveled in 2020 was 972.3 million on I-405, between Tukwila and Lynnwood, down almost 13% from 1.1 billion in 2019. Travelers on this corridor experienced 446 thousand hours of vehicle delay in 2020, down 83% from 2019.
In 2019, about 1.1 billion person miles were traveled in the GP lanes on I-405 between Tukwila and Lynnwood, the same as in 2018. Travelers on this corridor experienced 2.7 million hours of vehicle delay in 2019, the same as in 2018. Approximately 98% of available parking spaces at Park & Ride lots along this corridor were occupied in 2019, up from 96% in 2018.