Travel volume and speed trends dashboard
Our travel volume and speed trends dashboard (TVST) shares highway, toll and freight travel data , focusing on the state's most-traveled commute corridors. The TVST dashboard uses data from our retired COVID-19 dashboard, which was developed to give regular updates on how the pandemic affected statewide travel. We strive to update this data daily.
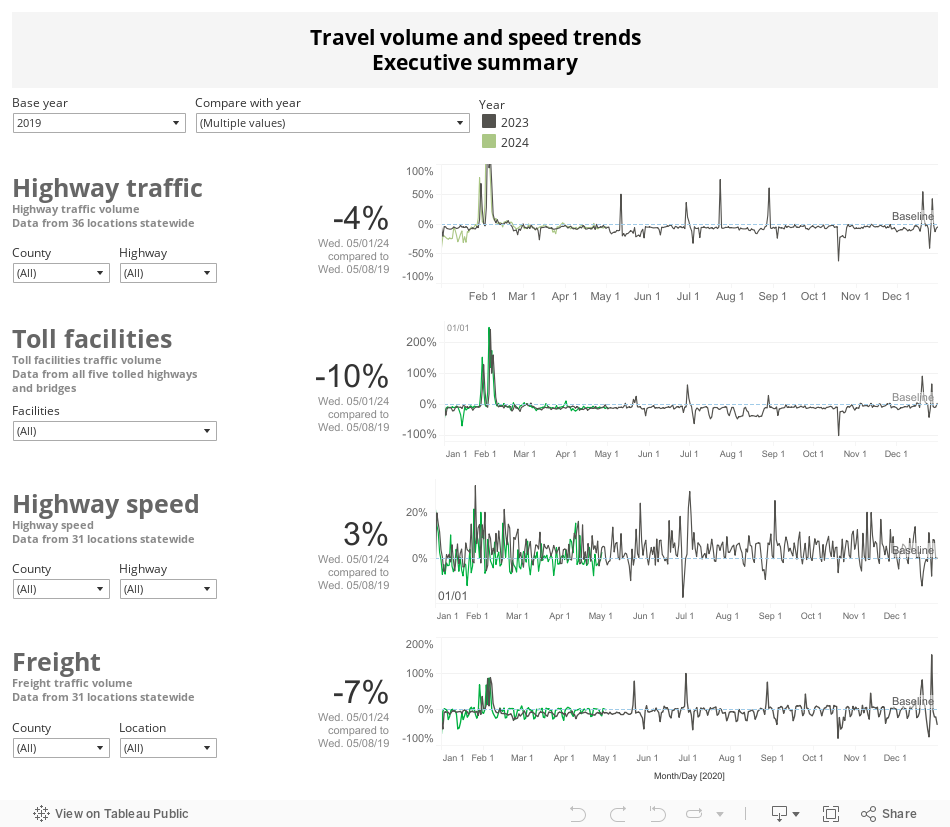
It includes four categories
- Highway traffic volume - compares traffic volumes from 36 spot locations in nine counties to a baseline from 2020-2025
- Toll facilities traffic volume - compares five toll facilities traffic volumes to a baseline from 2020-2025
- Highway speeds - compares traffic speeds from spot locations in eight counties to a baseline from 2020-2025
- Freight traffic volume - compares freight traffic volumes from spot locations in eight counties to a baseline from 2020-2025
Using the dashboard
More about the travel volume and speed trends dashboard
The TVST dashboard is currently a pilot project. It helps analyze transportation trends that are occurring on select state-owned facilities. It focuses on spot analysis where you can look for trends, congestion, volumes and speeds. Through this continuous improvement process, WSDOT looks to increase the TVST dashboard's value, expanding its offerings to include more multimodal performance data.
If you wish to download any of the data in this dashboard, please see the Data Disclaimer.
To view information on the impact of COVID-19 on state transportation performance, visit COVID-19 Multimodal Transportation System Performance Dashboard.
Have feedback or questions? Reach out to us at TSSApublications@wsdot.wa.gov