How to use the Travel volume and speed trends dashboard
About Travel volume and speed trends dashboard
Our travel volume and speed trends dashboard (TVST) shares highway, toll and freight travel data , focusing on the state's most-traveled commute corridors. The TVST dashboard uses data from our retired COVID-19 dashboard, which was developed to give regular updates on how the pandemic affected statewide travel. We strive to update this data daily.
It includes four categories
Highway traffic volume - compares traffic volumes from 36 spot locations in nine counties to a baseline from 2016-2022
Toll facilities traffic volume - compares five toll facilities traffic volumes to a baseline from 2016-2022
Highway speeds - compares traffic speeds from spot locations in eight counties to a baseline from 2016-2022
Freight traffic volume - compares freight traffic volumes from spot locations in eight counties to a baseline from 2016-2022
Navigation
This dashboard includes two navigation tools:
1 This menu allows quick navigation to previously visited pages2 This menu lets the user navigate between individual pages
Page components
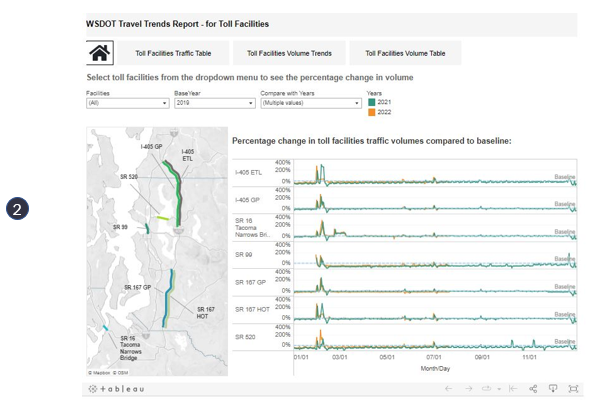
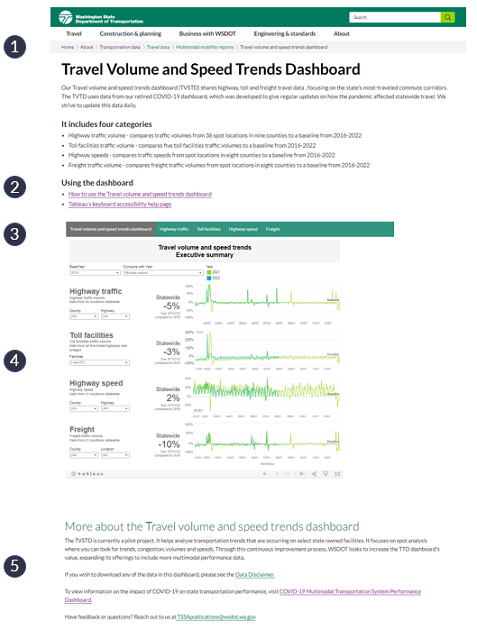
Pages in the Travel trend dashboard sections have the following components: 1 Top navigation, 2 How to use dashboard, 3 Page navigation, 4 Charts, 5 About the dashboad
Page navigation
Allows the user to jump directly to a section of interest such as toll dashboard.
Charts
Allow deeper dives into the data underlying the content of the section. The chart in the example is set to display traffic volume comparison based year and compare year on toll traffic volume
Downloading data
To download images and data from the charts:
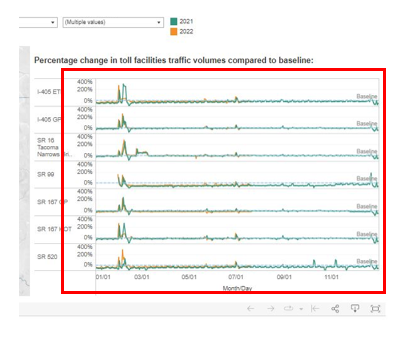
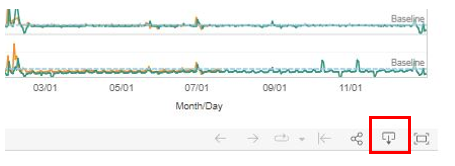
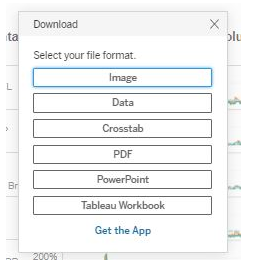
Hover over the chart and click on and empty area of the chart.Click the Download button at the bottom of the chart.A download selection menu will pop up. To download data, select "Data" or "Crosstab." Selecting "Data" will open a new browser tab from which the user download all of the data in the chart as a .csv file. Selecting "Crosstab" will let the user choose whether to download all of the data in the chart or only one section of it (for example, only the data for the northbound part of a delay chart), as well as whether to download the data as an Excel file or a .csv file. Selecting "Image", "PDF" and "PowerPoint" will allow the user to download an image of chart in the selected format.
Sharing charts
To share a chart and its data with others:
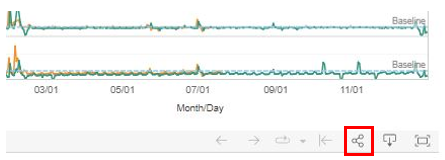
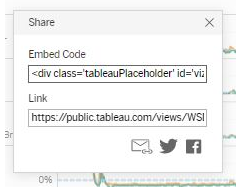
Click on the share button at the bottom of the chart.A window with fields labeled "Embed Code" and "Link" will pop up. If you are sharing the chart via e-mail, copy the text from the "Link" field and paste it into the body of your email. If you would like to embed the chart into a website, copy and paste the text from the "Embed Code" field. Top of page