Washington State Ferries - Ridership & capacity utilization
On this page:
Measures of Washington State Ferries performance: Ridership & capacity utilization
Ridership & capacity utilization
Ferry ridership is the number of passenger and vehicle trips taken on ferries within a defined time frame (quarterly, annually, etc.), reported system-wide or for specific ferry routes. Ferry capacity utilization is calculated as the percentage of available vehicle (or passenger) capacity that is used for each trip over all trips on that route for a defined time frame (quarterly, annually, etc.). This information is collected at tickets booths and compared to vessels' capacity. For details on the methodology used to calculate Washington State Ferries ridership and capacity utilization, refer to Ferry Performance Analysis methodology (PDF 5.9MB).
Source: Washington State Ferries.
Performance highlights
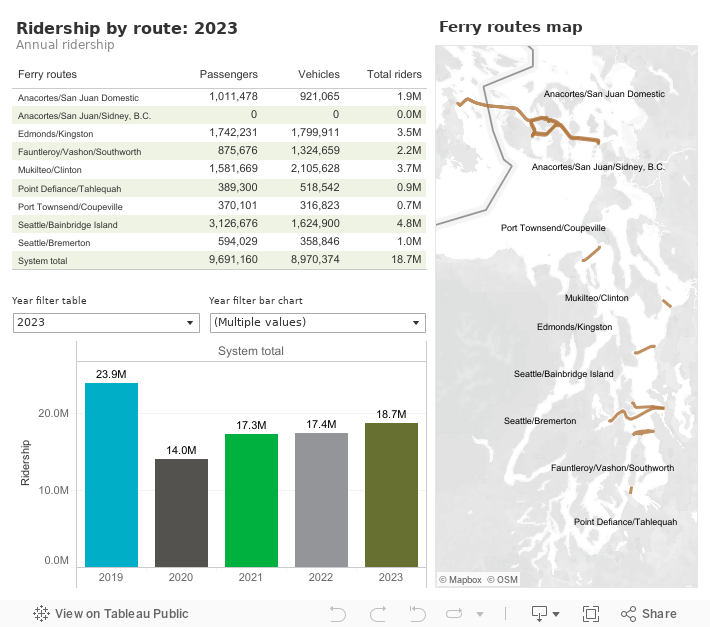
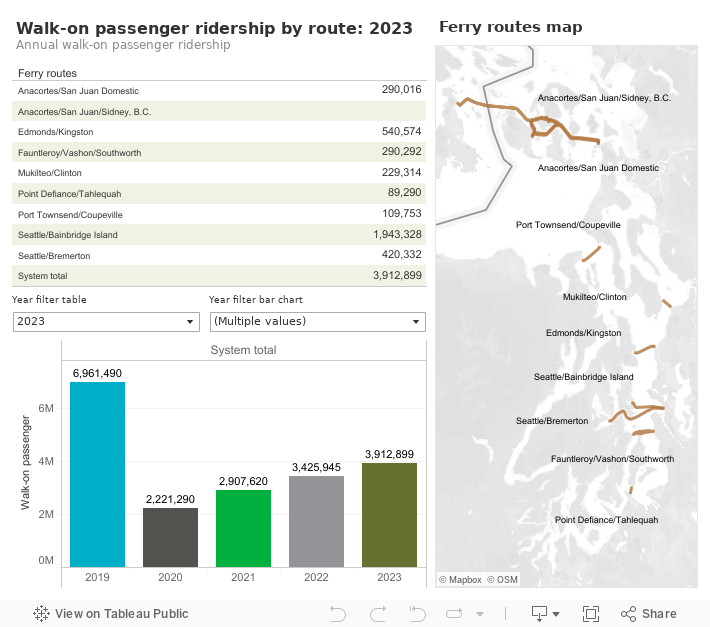
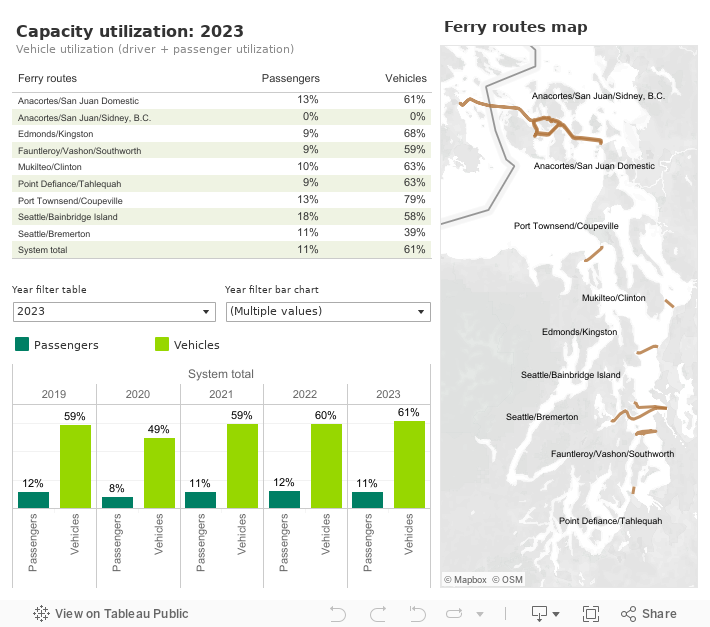
In 2023, WSF ridership was 18,661,534—up 7.4% from 17,374,169 in 2022. Walk-on passenger ridership was 3,912,899 up 14.2% from 3,425,945 in 2022. In 2023, the utilization of vehicle spaces on all ferry trips averaged 61%. Vehicle space utilization on individual ferry routes ranged between 39% (Seattle/Bremerton) and 79% (Port Townsend/Coupeville) in 2023. Ferry route utilization is based on ridership and vessel capacity, and reflects utilization for all sailings over the entire day. Because ferry vessels can carry many more passengers than vehicles, the passenger utilization rates are lower, ranging from 9% (Point Defiance/Tahlequah) to 18% (Seattle/Bainbridge Island) of the available capacity in 2023.
In 2022, systemwide WSF ridership was 17,374,169—up 0.5% from 17,279,879 in 2021. Walk-on passenger ridership was 3,425,945 up 17.8% from 2,907,620 in 2021. In 2022, the utilization of vehicle spaces on all ferry trips averaged 60%. Vehicle space utilization on individual ferry routes ranged between 37% (Seattle/Bremerton) and 78% (Port Townsend/Coupeville) in 2022. Ferry route utilization is based on ridership and vessel capacity, and reflects utilization for all sailings over the entire day, not for peak periods as used to track capacity for most other transportation modes. Because ferry vessels can carry many more passengers than vehicles, the passenger utilization rates are lower, ranging from 8% (Point Defiance/Tahlequah) to 17% (Seattle/Bainbridge Island) of the available capacity in 2022.
In 2021, systemwide WSF ridership was 17,279,879, up 23.5% from 13,986,702 in 2020. Walk-on passenger ridership was 2,907,620, up 30.1% from 2,221,290 in 2020. In 2021, the utilization of vehicle spaces on all ferry trips averaged 59%. Vehicle space utilization on individual ferry routes ranged between 40% (Seattle/Bremerton) and 74% (Port Townsend/Coupeville) in 2021. Ferry route utilization is based on ridership and vessel capacity, and reflects utilization for all sailings over the entire day, not for peak periods as used to track capacity for most other transportation modes. Because ferry vessels can carry many more passengers than vehicles, the passenger utilization rates are lower, ranging from 8% (Fauntleroy/Vashon/Southworth) to 15% (Seattle/Bainbridge Island) of the available capacity in 2021.
In 2020, systemwide WSF ridership was 13,986,702, down 41.4% from 23,884,789 in 2019. Walk-on passenger ridership was 2,221,290, down 68.1% from 6,956,139 in 2019. In 2020, the utilization of vehicle spaces on all ferry trips averaged 49%. Vehicle space utilization on individual ferry routes ranged between 32% (Seattle/Bremerton) and 67% (Port Townsend/Coupeville) in 2020. Ferry route utilization is based on ridership and vessel capacity, and reflects utilization for all sailings over the entire day, not for peak periods as used to track capacity for most other transportation modes. Because ferry vessels can carry many more passengers than vehicles, the passenger utilization rates are lower, ranging from 7% (Fauntleroy/Vashon/Southworth) to 12% (Anacortes/San Juan/Sidney) of the available capacity in 2020.
In 2019, systemwide WSF ridership was 23,884,789, down 3.2% from 24,687,038 in 2018. Walk-on passenger ridership was 6,956,139, down 4.1% from 7,256,372 in 2018. In 2019, the utilization of vehicle spaces on all ferry trips averaged 59%, the same as in 2018. Vehicle space utilization on individual ferry routes ranged between 42% (Seattle/Bremerton) and 77% (Port Townsend/Coupeville) in 2019. Ferry route utilization is based on ridership and vessel capacity, and reflects utilization for all sailings over the entire day, not for peak periods as used to track capacity for most other transportation modes. Because ferry vessels can carry many more passengers than vehicles, the passenger utilization rates are lower, ranging from 9% (Point Defiance/Tahlequah) to 18% (Anacortes/San Juan/Sidney, B.C.) of the available capacity in 2019.