Highway Safety - Fatality & serious injury rates
On this page:
Fatality & serious injury rates
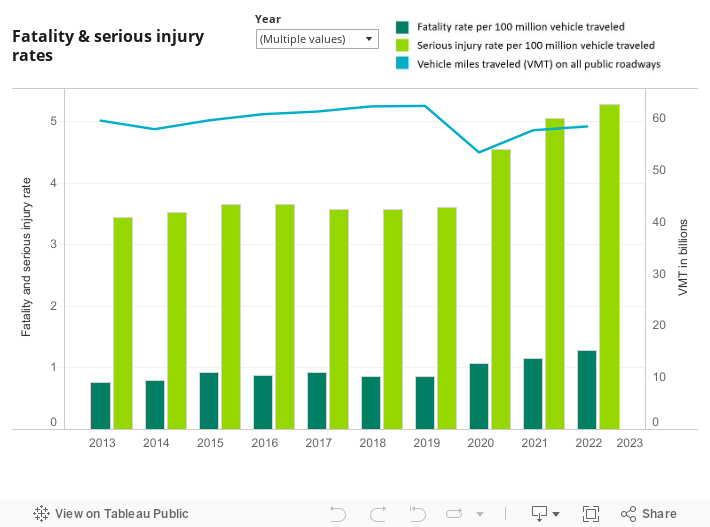
Source: WSDOT Transportation Data, GIS and Modeling Office; the Coded Fatal Crash System (CFC), Washington Traffic Safety Commission.
Notes: The numbers for fatalities in this chart represent individual people whose lives were ended prematurely due to a preventable crash on Washington state roadways. People who were seriously injured on these roadways may have had their lives permanently altered as a result of crashes. Serious injuries include: severe lacerations resulting in exposure of underlying tissues, muscle, or organs or resulting in significant loss of blood, broken or distorted extremities (arm or leg), crush injuries, suspected skull, chest, or abdominal injuries (other than bruises or minor lacerations), significant burns (second and third degree burns over 10 percent or more of the body), unconsciousness when taken from the crash scene, and paralysis. Fatality and serious injury numbers are updated as new information becomes available and, as a result, may not match numbers from previous Gray Notebook Safety articles. Statewide traffic fatalities and serious injuries on public roadways are per 100 million vehicle miles traveled (VMT); Statewide VMT on public roadways is in billions of miles. Gray Notebook fatality and serious injury numbers for 2019-2023 were updated with 2023 data (most recent available).
Performance analysis
2023
Fatality and serious injury rates and vehicle miles traveled both increase in 2023
The rate of traffic fatalities per 100 million vehicle miles traveled increased 6.3% from 1.27 in 2022 to 1.35 in 2023. During the same period, the serious injury rate increased 7.7% from 5.30 to 5.71 per 100 million vehicle miles traveled.
The rate of traffic fatalities per 100 million vehicle miles traveled increased 70.9% in the last decade going from .790 in 2019 to 1.35 in 2023. Similarly, the serious injury rate increased 65.5% during this same period going from 3.45 in 2019 to 5.71 in 2023.
Traffic fatalities and serious injury rates are reported per 100 million miles driven to standardize comparisons of traffic safety across regions and states reporting to the National Highway Traffic Safety Administration. This measure helps assess the risk of fatal or serious accidents relative to driving activity, offering a clearer picture of road safety regardless of population size.
2022
Injury rates and vehicle miles traveled both increase in 2022
The rate of traffic fatalities per 100 million vehicle miles traveled increased 9.4% from 1.17 in 2021 to 1.28 in 2022. During the same period, the serious injury rate increased 11.6% from 4.56 to 5.09 per 100 million vehicle miles traveled. The higher increase in the injury rate indicates that the number of crashes is going up more than expected compared to pre-COVID volumes.
2021
Injury rates and vehicle miles traveled both see increases in 2021
The rate of traffic fatalities per 100 million vehicle miles traveled increased 7.5% from 1.01 in 2020 to 1.15 in 2021. During the same period, the serious injury rate increased 11.6% from 4.56 to 5.09 per 100 million vehicle miles traveled.
With a 7.35% increase in annual vehicle miles traveled from 53.5 billion miles in 2020 to 57.5 billion miles in 2021, these increases suggest driving patterns and behaviors that changed during the pandemic are continuing and drivers are still taking unnecessary risks, including speeding, failing to wear seat belts, and driving under the influence of drugs or alcohol.
2020
Fatality and serious injury rates increase from 2016 to 2020
The rate of traffic fatalities increased 18% from 0.881 to 1.04 from 2016-2020 and the serious injury rate increased 25% during the same period from 3.645 to 4.558 per 100 million vehicle miles traveled.
With a 14% decline in vehicle miles traveled from 2019 to 2020, these increases suggest that throughout the pandemic, driving patterns and behaviors changed significantly, and that more drivers engaged in risky behavior, including speeding, failing to wear seat belts, and driving under the influence of drugs or alcohol.
2019
Fatality rate decreases from 2015 to 2019
While vehicle miles traveled increased 4.7% from 59.7 billion in 2015 to 62.5 billion in 2019, the rate of traffic fatalities in comparison has decreased 9.3% from 0.924 to 0.838 during this five-year period. Meanwhile, the serious injury rate has increased slightly during this time, up 0.2% from 3.591 to 3.599 per 100 million vehicle miles traveled.