Vancouver region Interstate 205 - Dashboard
On this page:
Performance indicators for I-205 in the Vancouver region
Indicators
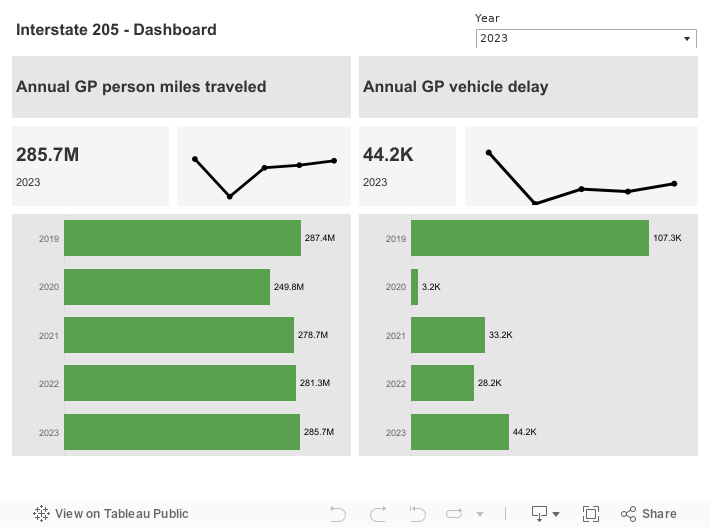
This dashboard shows two multimodal performance indicators for Interstate 205 in the Vancouver region:
- Annual general purpose (GP) lane person miles traveled
- Annual GP vehicle delay
For details on methodology to calculate person miles traveled and vehicle delay, refer to WSDOT's
Handbook for Corridor Capacity Evaluation (PDF 5.9MB).
Sources: WSDOT Transportation Safety and Systems Analysis Division and WSDOT TRACFLOW (https://tracflow.wsdot.wa.gov/)
Performance highlights
More than 285.7 million person miles were traveled in the GP lanes on I-205 between the I-5/I-205 interchange and the I-205 Glenn Jackson Bridge in 2023, a 1.6% increase over the 281.3 million in 2022.
Travelers on this corridor experienced 44,200 hours of vehicle delay in 2023, an 56.7% increase from 28,200 hours in 2022.
In 2022, traffic volumes continued to recover in the wake of COVID-19. Annual person miles traveled increased from 2021 and approached the pre-pandemic levels. However, annual vehicle delay decreased from 2021 was significantly below the pre-pandemic levels. Nearly 281.3 million person miles were traveled on I-205 between the I-5/I-205 interchange and the I-205 Glenn Jackson Bridge, up 0.9% from 278.7 million in 2021. Travelers on this corridor experienced 28,200 hours of vehicle delay in 2022, down 15% from 33,200 hours in 2021.
In 2021, annual person miles traveled and vehicle delay increased from 2020, due to the recovery of traffic volume in the wake of COVID-19. Nearly 278.7 million person miles were traveled on I-205 between the I-5/I-205 interchange and the I-205 Glenn Jackson Bridge, up 12% from 249.8 million in 2020. Travelers on this corridor experienced 33,200 hours of vehicle delay in 2021, up about 950% from 3,200 hours in 2020. The Evergreen Transit Center remained temporarily closed for use as a Safe Parking Zone, and served as a place for people sheltering in their vehicles.
In 2020, the statewide response to COVID-19 resulted in a significant reduction in person miles traveled and annual delay. Nearly 249.8 million person miles were traveled on I-205 between the I-5/I-205 interchange and the I-205 Glenn Jackson Bridge, down 13% from 287.4 million in 2019. Travelers on this corridor experienced 3,200 hours of vehicle delay in 2020, down 97% from 107,300 in 2019. The Evergreen Transit Center was temporarily closed for use as a Safe Parking Zone, and served as a place for people sheltering in their vehicles.
In 2019, nearly 287.4 million person miles were traveled on I-205 between the I-5/I-205 interchange and the I-205 Glenn Jackson Bridge, down 0.8% from 289.8 million in 2018. Travelers on this corridor experienced 107,300 hours of vehicle delay in 2019, up 17% from 91,400 in 2018. Approximately 15% of the parking spaces at park and ride lots on this corridor were occupied in 2019.
In 2018, nearly 289.8 million person miles were traveled on I-205 between the I-5/I-205 interchange and the I-205 Glenn Jackson Bridge, up 2% from 284.1 million in 2017. Travelers on this corridor experienced 91,400 hours of vehicle delay in 2018, down 20% from 114,000 in 2017.