Public transportation - Passenger trips
On this page:
Measure of public transportation usage: Passenger trips
Public transportation passenger trips
Passenger trips: Passenger trips are the total number of single passenger trips boardings. A passenger trip may not be an individual's entire commute. For example, throughout their commute, an individual may transfer from one bus to another or transfer from one mode to another (for example, from a ferry to a bus). Regardless of transfer or change in mode, each boarding is counted as a single passenger trip.
Source: WSDOT Public Transportation Division.
Performance highlights
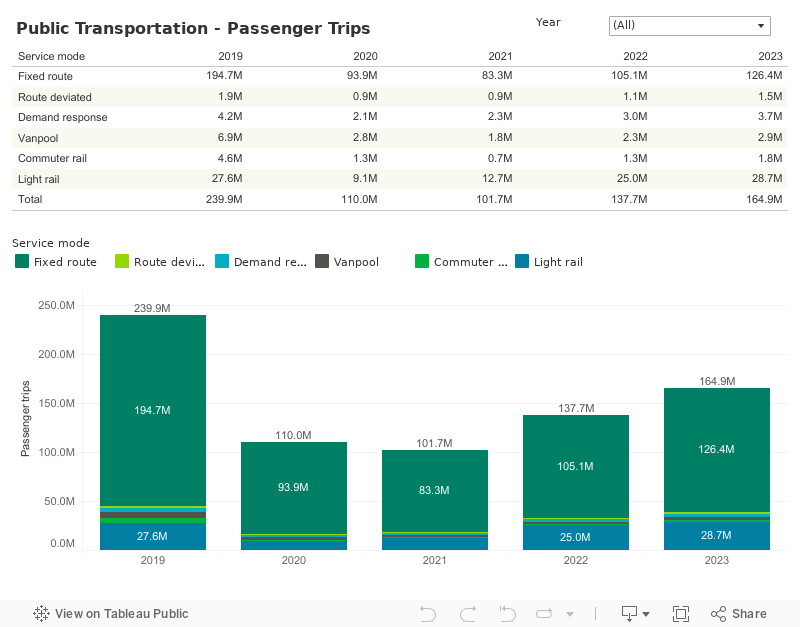
In 2023, public transportation passengers grew 19.8% to 164.9 million, from 137.7 million in 2022. Fixed route service made up about 76.6% of total public transportation passenger trips statewide, up 0.3% from 76.4% in 2022. Additionally, light rail passenger trips increased 14.8% from 25.0% in 2022 to 28.7 million in 2023.
In 2022, the total number of public transportation passengers grew to 137.7 million from 101.7 million in 2021. This is a 35.4% increase in passenger numbers. Fixed route service made up about 76.4% of total public transportation passenger trips statewide, down from 81.9% in 2021. Additionally, light rail passenger trips have increased 96.6% from 2021 to 25.0 million passenger trips.
In 2021, the total number of public transportation passengers dropped to 101.7 million from 110.0 million in 2020. This is a 7.5% reduction in passenger numbers. Fixed route service made up about 81.9% of total public transportation passenger trips statewide, down from 85.4% in 2020. Additionally, light rail passenger trips have increased 39.9% from 2020 to 12.7 million passenger trips.
In 2020, the total number of public transportation passengers dropped to 110 million from 239.9 million in 2019. This 54.1% reduction in passengers was due to the COVID-19 pandemic. Fixed route service made up about 85.4% of total public transportation passenger trips statewide, up from 81.2% in 2019. Additionally, light rail passenger trips have decreased 67.0% from 2019 to 9.1 million passenger trips.
In 2019, total Public Transportation passenger trips decreased by 0.5% statewide, from around 241.1 million in 2018 to 239.9 million. This was the first annual decrease in total public transportation passenger trips statewide since 2009. Fixed route service made up about 81.2% of total public transportation passenger trips statewide, down from 81.3% in 2018. Additionally, light rail passenger trips have increased 1.8% from 2018 to 27.6 million passenger trips.
In 2018, total public transportation passenger trips increased by 0.9% statewide, from around 238.8 million in 2017 to 241.1 million. Fixed route service made up about 81.3% of total public transportation passenger trips statewide, down from 81.8% in 2017. Additionally, light rail passenger trips have increased 6.6% from 2017, reaching 27.1 million passenger trips.
In 2017, total public transportation passenger trips increased by 1.6% statewide, from around 235 million in 2016 to 238.8 million. Fixed route service made up about 81.8% of total public transportation public transportation passenger trips statewide, down from 83.2% in 2016. Additionally, light rail passenger trips have increased 19.2% from 2015 to 25.4 million public transportation passenger trips.