Central Puget Sound State Route 520 - Dashboard
On this page:
Performance indicators for SR 520 in the central Puget Sound region.
Indicators
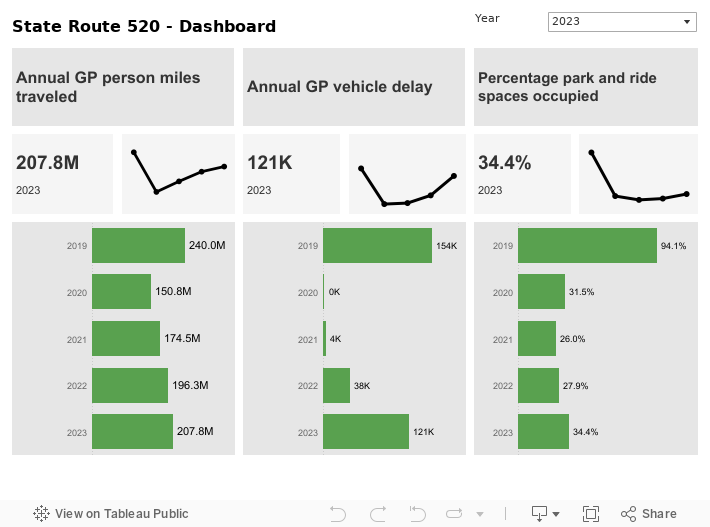
This dashboard shows three multimodal performance indicators for State Route 520 in the central Puget Sound region:
- Annual general purpose (GP) lane person miles traveled
- Annual GP vehicle delay
- Percentage of park and ride spaces occupied
For details on the methodology used to calculate person miles traveled and vehicle delay, refer to WSDOT's Handbook for Corridor Capacity Evaluation (PDF 5.9MB).
Sources: WSDOT Transportation Safety and Systems Analysis Division and WSDOT TRACFLOW (https://tracflow.wsdot.wa.gov/)
Performance highlights
Annual GP person miles traveled and vehicle delay increased in 2023 from 2022, nearing pre-pandemic levels. More than 207 million person miles were traveled in the GP lanes on SR 520 between Seattle and Redmond, up 5.6% from 196 million in 2022. Travelers on this corridor experienced 121,000 hours of vehicle delay in 2023, an increase of approximately 218% compared to 38,000 hours delay in 2022.
In 2022, annual GP person miles traveled and vehicle delay increased from 2021, due to the ongoing recovery of traffic volume in the wake of COVID-19. Nearly 196 million person miles were traveled in the GP lanes on SR 520 between Seattle and Redmond, up 12% from 175 million in 2021. Travelers on this corridor experienced 38,000 hours of vehicle delay in 2022, compared to 4,000 hours delay in 2021.
In 2021, annual GP person miles traveled and vehicle delay increased compared to 2020, due to the recovery of traffic volume in the wake of COVID-19. Nearly 175 million person miles were traveled in the GP lanes on SR 520 between Seattle and Redmond, up 16% from 151 million in 2020. Travelers on this corridor experienced 4,000 hours of vehicle delay in 2021, compared to no delay in 2020.
In 2020, the statewide response to COVID-19 resulted in a significant reduction in GP person miles traveled and annual delay. Nearly 151 million person miles were traveled in the GP lanes on SR 520 between Seattle and Redmond, down 37% from 240 million in 2019. Travelers on this corridor experienced no vehicle delay in 2020, down 100% from 154,000 in 2019.
In 2019, about 240 million person miles were traveled in the GP lanes on SR 520 between Seattle and Redmond, down 2% from 244 million in 2018. Travelers on this corridor experienced 154,000 hours of vehicle delay in 2019, down 2% from 157,000 in 2018. Approximately 95% of available parking spaces at Park & Ride lots on this corridor were occupied in 2019, up from 82% in 2018.