Central Puget Sound State Route 167 - Dashboard
On this page:
Performance indicators for SR 167 in the central Puget Sound region
Indicators
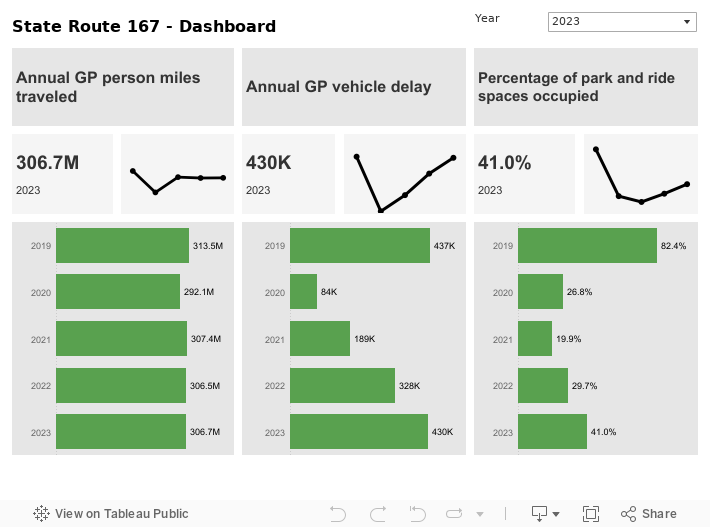
This dashboard shows three multimodal performance indicators for State Route 167 in the central Puget Sound region:
- Annual general purpose (GP) lane person miles traveled
- Annual GP vehicle delay
- Percentage of park and ride spaces occupied.
For details on the methodology used to calculate person miles traveled and vehicle delay, refer to WSDOT's Handbook for Corridor Capacity Evaluation (PDF 5.9MB).
Sources: WSDOT Transportation Safety and Systems Analysis Division and WSDOT TRACFLOW (https://tracflow.wsdot.wa.gov/)
Performance highlights
In 2023, annual GP person miles were similar to that in 2022. Nearly 306.7 million person miles were traveled in the GP lanes on SR 167 between Renton and Auburn, up 0.06% from 306.5 million in 2022. However, the vehicle delay increased 31% from 2022 with travelers experiencing 430,000 hours of vehicle delay in 2023, up from 328,000 hours in 2022.
In 2022, annual GP person miles were similar to that in 2021: Nearly 306.5 million person miles were traveled in the GP lanes on SR 167 between Renton and Auburn, down 0.3% from 307.4 million in 2021. However, the vehicle delay increased significantly from 2021: Travelers on this corridor experienced 328,000 hours of vehicle delay in 2022, up 74% from 189,000 hours in 2021.
In 2021, annual GP person miles traveled and vehicle delay increased from 2020, due to the recovery of traffic volume in the wake of COVID-19. Nearly 307 million person miles were traveled in the GP lanes on SR 167 between Renton and Auburn, up 5% from 292 million in 2020. Travelers on this corridor experienced 189,000 hours of vehicle delay in 2021, up 125% from 84,000 hours in 2020.
In 2020, the statewide response to COVID-19 resulted in a significant reduction in GP person miles traveled and annual delay. Nearly 292 million person miles were traveled in the GP lanes on SR 167 between Renton and Auburn, down 7% from 314 million in 2019. Travelers on this corridor experienced 84,000 hours of vehicle delay in 2020, down 81% from 437,000 in 2019.
In 2019, nearly 314 million person miles were traveled in the GP lanes on SR 167 between Renton and Auburn, up 1% from 312 million in 2018. Travelers on this corridor experienced 437,000 hours of vehicle delay in 2019, up 20% from 368,000 in 2018. Approximately 77% of available parking spaces at Park & Ride lots on this corridor were occupied in 2019, down from 78% in 2018.