Central Puget Sound Interstate 90 - Dashboard
On this page:
Performance indicators for I-90 in the central Puget Sound region
Indicators
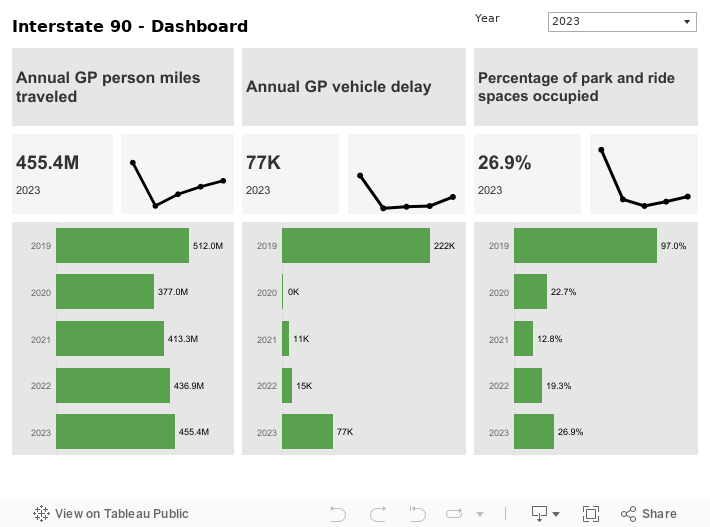
This dashboard shows three multimodal performance indicators for Interstate 90 in the central Puget Sound region:
- Annual general purpose (GP) lane person miles traveled
- Annual GP vehicle delay
- Percentage of park and ride spaces occupied.
For details on the methodology used to calculate person miles traveled and vehicle delay, refer to WSDOT's Handbook for Corridor Capacity Evaluation (PDF 5.9MB).
Sources: WSDOT Transportation Safety and Systems Analysis Division and WSDOT TRACFLOW (https://tracflow.wsdot.wa.gov/)
Performance highlights
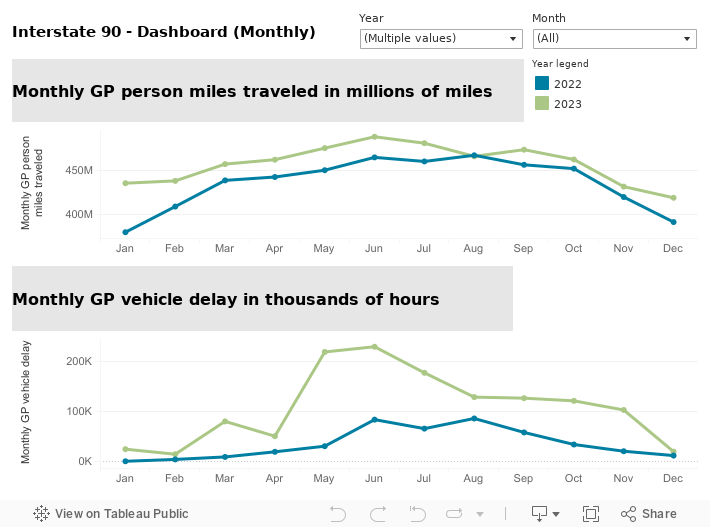
Annual GP person miles traveled and vehicle delay increased in 2023 compared to 2022, due to the ongoing recovery of traffic volume in the wake of COVID-19. Nearly 455 million person miles were traveled in the GP lanes on I-90 between Seattle and Bellevue, up 4.1% from 437 million in 2022. Travelers on this corridor experienced 77,000 hours of vehicle delay in 2023, up 413% from 15,000 hours in 2022.
In 2022, annual GP person miles traveled and vehicle delay increased compared to 2021, due to the ongoing recovery of traffic volume in the wake of COVID-19. Nearly 437 million person miles were traveled in the GP lanes on I-90 between Seattle and Bellevue, up 6% from 413 million in 2021. Travelers on this corridor experienced 15,000 hours of vehicle delay in 2022, up 36% from 11,000 hours in 2021.
In 2021, annual GP person miles traveled and vehicle delay increased from 2020, due to the recovery of traffic volume in the wake of COVID-19. Nearly 413 million person miles were traveled in the GP lanes on I-90 between Seattle and Bellevue, up 10% from 377 million in 2020. Travelers on this corridor experienced 11 thousand hours of vehicle delay in 2021, up from no delay in 2020
In 2020, the statewide response to COVID-19 resulted in a significant reduction in GP person miles traveled and annual delay. Nearly 377 million person miles were traveled in the GP lanes on I-90 between Seattle and Bellevue, down over 26% from 512 million in 2019. Travelers on this corridor experienced no vehicle delay in 2020, down from 222,000 in 2019.
In 2019, about 512 million person miles were traveled in the GP lanes on I-90 between Seattle and Bellevue, up 1% from 506 million in 2018. Travelers on this corridor experienced 222,000 hours of vehicle delay in 2019, down 17% from 222,000 in 2018. Approximately 86% of available parking spaces at Park & Ride lots on this corridor were occupied in 2019, up from 82% in 2018.