About the GNB site

On this page:

About the Interactive Gray Notebook

The interactive Gray Notebook (GNB) is our agency's quarterly performance and accountability report. Editions feature quarterly, semi-annual, annual and biennial updates on key agency functions and provide in-depth analysis of topics that align with Washington's transportation goals as well as our strategic plan.

Gray Notebook content is separated into the following sections:

  • Executive direction (Strategic Plan, Statewide transportation policy goals, Transportation Performance Management)
  • Safety (GNB articles: Active Transportation Safety, Highway Safety, and Worker Safety)
  • Preservation (GNB articles: Aviation, Bridges, Capital Facilities, Highway Maintenance, Pavement, and WSF Vessels & Terminals)
  • Mobility (GNB articles: Amtrak Cascades, Incident Response, Travel Information, and Washington State Ferries)
  • Environmental (GNB articles: Electric Vehicles, Fish Passage, Water Quality, Wetlands, and Wildlife Habitat Connectivity)
  • Economic vitality (GNB articles: Commercial Vehicles, Freight, and Freight Rail)
  • Stewardship (GNB articles: Advertisement Record & Change Orders, Completed Projects & Contracts, and Pre-Existing Funds)

Main page

The main page includes three navigation tools:

1 This menu allows quick navigation to previously visited pages
Breadcrumb navigation image
2 This is a main menu selection
Main menu image
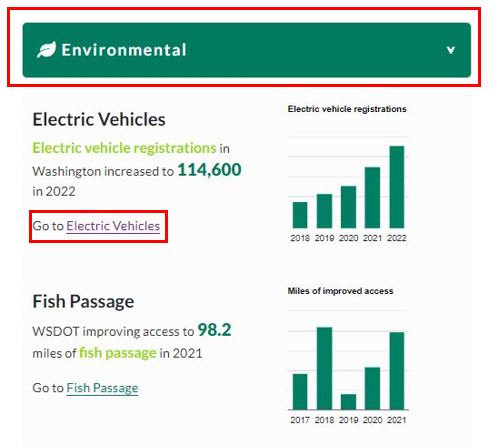
3 The menu opens when the button is selected. Selecting "Go to Electric Vehicles" will take users to this subject content.
Main menu open image

Page components

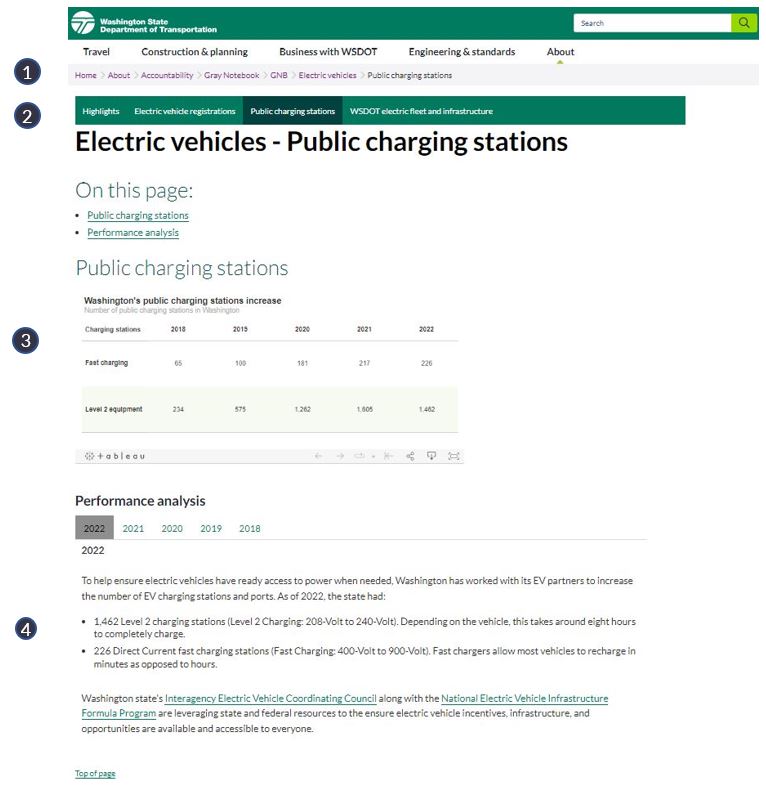
Subject pages in the Gray Notebook have the following components: 1 Top navigation, 2 Page navigation, 3 Charts and
4 Performance analysis.
CCR subject overall image

Page navigation

Allows the user to jump directly to areas of interest within a subject.
Section jump image

Charts

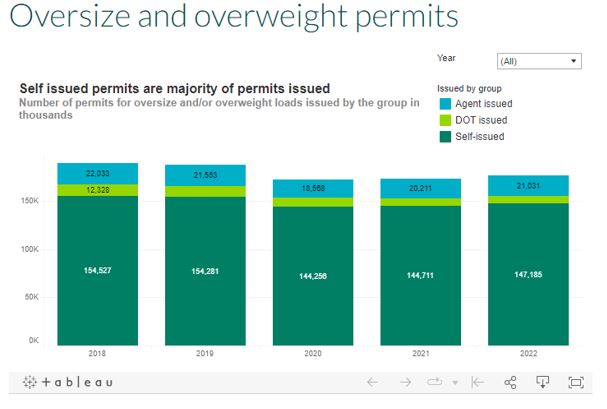
Charts allow users to make deeper dives into the data underlying the content of the section. The chart in the example is shows the number of permits for oversize and/or overweight loads issued and by which group.
Chart sample image

Performance analysis

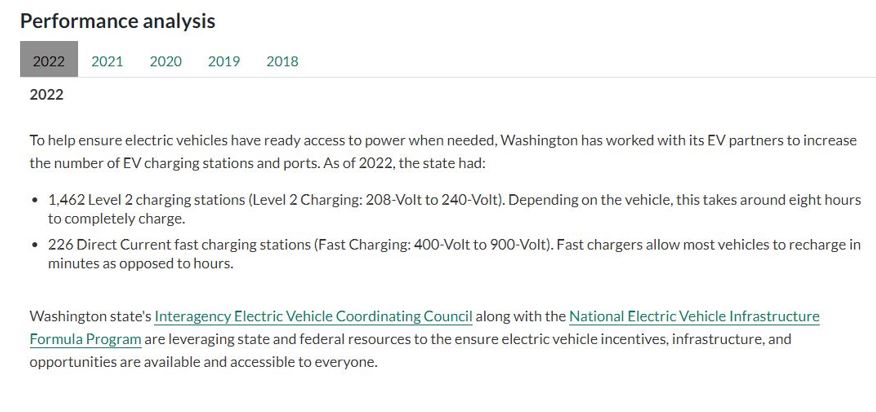
Performance analysis provide addition insight into data changes in the performance measure, such as the differences between 2021 and 2022 and, if warranted, the reasons behind these changes.
Detail Performance analysis text image

Downloading data

To download images and data from the charts:
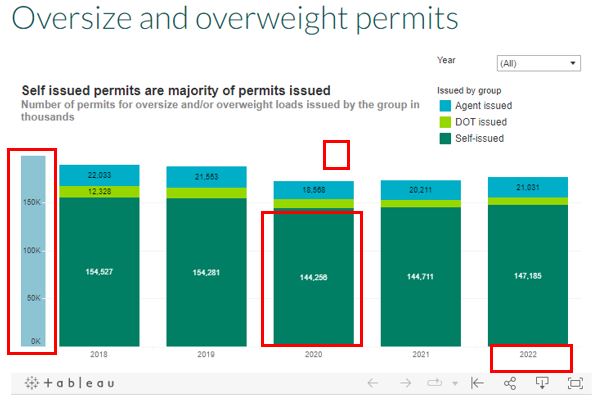
Click on one of the places, depending on the desired data range being downloaded.
Download image


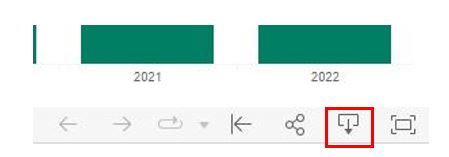
Select the "download" button at the bottom of the chart.
Detail for each year image

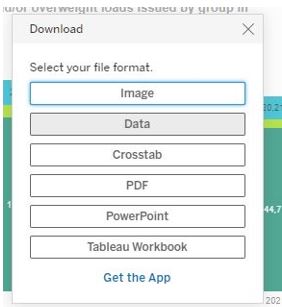
A download selection menu will pop up. To download data, select "Data" or "Crosstab." Selecting "Data" will open a new browser tab from which the user download all of the data in the chart as a .csv file. Selecting "Crosstab" will let the user choose whether to download all of the data in the chart or only one section of it (for example, only the data for the northbound part of a delay chart), as well as whether to download the data as an Excel file or a .csv file. Selecting "Image," "PDF" and "PowerPoint" will allow the user to download an image of chart in the selected format.
Detail for each year image

Sharing charts

To share a chart and its data with others:
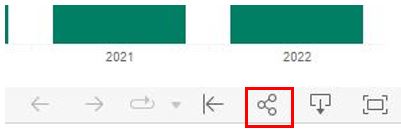
Select the "share" button at the bottom of the chart.
Detail for each year image

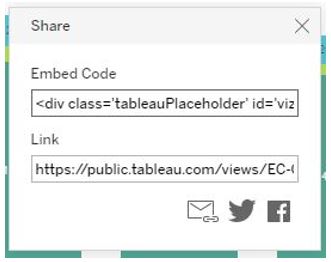
A window with fields labeled "Embed Code" and "Link" will pop up. To share the chart via e-mail, copy the text from the "Link" field and paste it into the body of the email. To embed the chart into a website, copy and paste the text from the "Embed Code" field.
Detail for each year image

Top of page