| MAP APP BASICS | LAYER SPECIFIC INFORMATION | INTERROGATE ACTIVE LAYERS |
|---|---|---|
| Tabs | WSDOT Fish Passage Sites | Retrieve Popup Information |
| Toolbar | Case Area Boundary | |
| Rivers and Lakes | ||
| NAVIGATING THE MAP | CHANGE HOW YOU SEE THE MAP | FEEDBACK |
| Move the Map | Map Layers | Report a Bug |
| Zoom In and Out | Drawing Order of Map Layers | Issue with Content |
| Zoom to Tools | Legend | |
| Zoom to Long./Lat. | Background Map | |
| Zoom to State Route Milepost | ||
By using this website you acknowledge that you understand and agree to the following conditions.
This map and associated layers of data are provided for the purpose of illustrating the challenges and complexity of work required to correct fish passage barriers under Washington State highways. The Washington State Department of Transportation (WSDOT) makes no guarantee concerning the data's content, accuracy, completeness, or the results obtained from queries or use of the data, including the underlying base maps. The data supporting this map are from the Washington State Department of Fish and Wildlife (WDFW). The data do not represent exhaustive inventories, but are compilations of knowledge from field biologists that are updated periodically as knowledge improves. It is important to note that habitats or species may occur on the ground in areas not currently known to those who prepared the data, or in areas for which comprehensive surveys have not been conducted. Site specific surveys are frequently necessary to rule out the presence of priority habitats or species. When planning or designing projects that may affect these sites, please consider using additional information gathered from field investigations and consultations with WSDOT, WDFW or other professional biologists. For WSDOT assistance on a specific project, or for more information, please contact:
Susan Kanzler
Stream Restoration Manager
Washington State Department of Transportation
(360) 705-7250
Susan.Kanzler@wsdot.wa.gov
Please note that the term “Potential Habitat Gain” on the pop-up tab for each site refers to the entire distance between the site and the natural end of fish habitat, excluding other human-caused barriers. This is the amount of upstream habitat that could potentially be accessed by fish if this and all other upstream barriers were removed, This map shows only barriers owned by WSDOT. There are many fish barriers in these streams that are not owned by WSDOT. WSDOT normally first corrects the highway barrier furthest downstream, providing incremental habitat gain up to the next barrier. The full Potential Habitat Gain is only achieved when all barriers on the stream are corrected.
Caveat: This map is updated on a weekly cycle and may result in a fluctuation of barrier numbers when barriers are added, removed or reclassified.


Fish Passage Sites comes from the WDFW Fish Passage and Diversion Screening Inventory database. It includes culverts, miscellaneous sites (fords, flumes, streambed controls, ...) and small diversion dams.
WDFW ID labels will appear when the scalebar reads 1 mile.
WSDOT Fish Passage Sites are represented in several different ways.
This is the Case Area Boundary for U. S. District Court Injunction No. C70-9213, Subproceeding No. 01-1, the U.S. versus Washington State. The case area comprises Water Resource Inventory Areas 1 to 23.
The Rivers and Lakes layer uses the hi-resolution National Hydrographic Dataset (NHD), a USGS product that is the Federal and State hydrographic data standard, and now forms the basis for ‘the blue lines’ on all USGS topographic maps. It depicts rivers and streams as lines, and also as polygons for larger rivers (NHD Area), along with lakes, ponds, and reservoirs (NHD Waterbodies).
Rivers and Lakes is a multi-scaled layer, meaning that as you zoom in you will see additional streams, waterbodies, and streams names. The maximum detail is seen when the scalebar reads 1mi.
Download this fish passage data at any of the following sites:
WSDOT Geospatial Open Data Portal
Washington Geospatial Open Data
back to top
Click and drag anywhere on the main map.
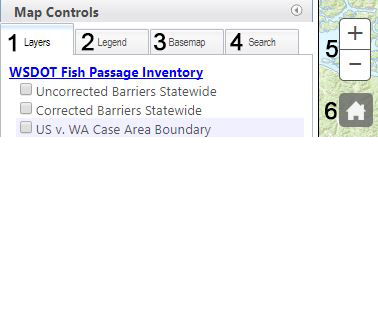
Adjust the map zoom by clicking the + and - buttons near the top left of the map. Alternatively, you can also use your mouse scroll wheel to zoom, or double click to zoom in one level.
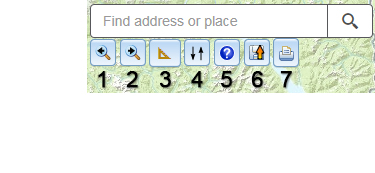
You can go back and forth to your previous extents and zooms by clicking on the next / previous extent buttons (magnifying glass icons in the ToolBar in the upper right of the map), like the back and forward buttons on a browser.
Return to full extent by clicking the home icon in the upper left of the map.
In the 'Search' tab, users can find tools to zoom to a specific fish passage site, state route milepost, longitude/latitude location, county, city, and urban area.
NOTE: If you select a site, but don't see a point, try turning on other fish passage layers.
Zoom to a Fish Passage Site, County, City, or Urban Area
1. Begin typing into the appropriate text box.
2. A list of items will appear in the box. You can keep typing to further narrow down the results.
3. Select your choice by clicking on it.
1. Type in the Longitude coordinate (X), and the Latitude coordinate (Y).
2. Click on the Zoom to XY button (the magnifying glass) to zoom to that location.
3. The tool will accept coordinates in decimal degrees (e.g. -122.089441, 46.596825). If you want the coordinate to be in the western hemisphere, be sure to make your longitude value negative.
1. Find Milepost - Type in a route number, an ARM or SRMP, and a reference date, and then click on the Find Milepost button. A graphic dot and a callout text box will be placed at the location that you specify. If the tool is unable to find your location, it will return an error message.
2. Find Nearest Milepost - Specify a search radius, and click on the Find button. Then click on the map to see the nearest State Route and Mile Post.
3. Click on the clear results button to clear the graphics off of your map.
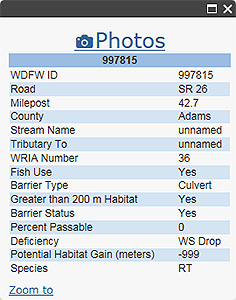
Click on any feature on the map, except Rivers and Lakes, and a popup window will appear that contains additional information about what you clicked on. If there are multiple active layers where you click, you can cycle through them using the arrow buttons at the top of the window. If you get too many features in the popup window try zooming in closer and/or turning off layers.
Click on Photos to view photos of a site, if available. The photos will open in a new tab, with thumbnails at the bottom if there are two or more photos. If no photos exist for a site, a message will indicate this. The photo carousel cycles through photos every five seconds, or you can scroll through on your own. For recently corrected barriers, both before and after photos may be available.
Below you will see an example of a popup and a list of abbreviations used in the popup with their definition.

| Abbreviations Used In Pop Up Fields | |
|---|---|
| Deficiency | Definition |
| WS Drop | Water Surface Drop |
| Species | Definition |
| CH | Chum |
| CK | Chinook |
| CO | Coho |
| BT | Bull Trout |
| PK | Pink |
| RT | Resident Trout |
| SH | Steelhead |
| SK | Sockeye |
| SRCT | Searun Cutthroat |
back to top
Click on the 'Layers' tab and then check the box of the map layer(s) you want to be visible. Once the box is checked, you can hover over the checkbox to enable the layer options arrow. Layer options will allow you to adjust the layer transparency or read the layer metadata (information about how the dataset was developed). The layer list is collapsible by clicking on the blue layer header.
Double-click the 'Arrange Layers' button in the Toolbar. This shows all the visible layers in your map. Drag and drop the layer names in the order that you want them to draw on the map (top layer draws last, i.e., on top of the other layers). You usually want the Basemap layers at the bottom. The basemap is only called “layer”. The default drawing order of layers is: the first layers you turn on draw first and the last layers you turned on draw last. For instance, if you turn on a fish barrier layer, then turn on the City Limits layer, the City Limits layer will draw over the fish barriers. Use the Arrange Layers tool to drag the city layer down in the list. The change to the map occurs as soon as you drag a layer.
The legend can be found under the 'Legends' tab. Only active and visible layers are shown in the legend.
Clicking the 'Basemap' tab allows you to select a different background map.
back to top
Did something not work right or go wrong while you were using Fish Passage Inventory map? Please let us know by emailing us with a detailed description of what happened, what you were doing, and the browser and version you were using when the issue happened.
Did you find errors within the content? Please contact us by email and let us know what is incorrect.
back to top