|
PGSplice
3.0
Precast-prestressed Spliced Girder Bridges
|
|
PGSplice
3.0
Precast-prestressed Spliced Girder Bridges
|
PGSplice has two robust facilities for reviewing results. Analysis results can be viewed graphically or in a report format. Let's explore the reporting features by looking at analysis results for the first exterior girder.
The Spec Check Report provides the details of a specification compliance check. The AASHTO criteria for service and strength limit states are evaluated as well as criteria for constructability, handling, and more.
To create the Spec Check Report
The Spec Check Report provides a detailed listing of the specification checks that were performed. The report starts with a summary so you know immediately if your girder has deficiencies. The summary is followed by the detailed specification checks that list the LRFD criteria, the allowable or required values, the provided or computed values, and a Pass/Fail status for the check. For many of the checks, a Capacity/Demand (C/D) ratio is computed.
For this particular example, we see that some of the specification checks did not pass. However, if we start to look at the details, most of the C/D ratios are very close to 1.0. This is a good sign as the original design was done based on the AASHTO Standard Specifications and simplified procedures for computing prestress losses.
TIP: The Table of Contents feature makes it easier to navigate reports. To view the Table of Contents, click the right mouse button over the report and select Table of Contents.
TIP: You can search the report for keywords. To search the report, click the right mouse button over the report window and select the Find option. In the Find dialog, enter the search keyword or phrase.
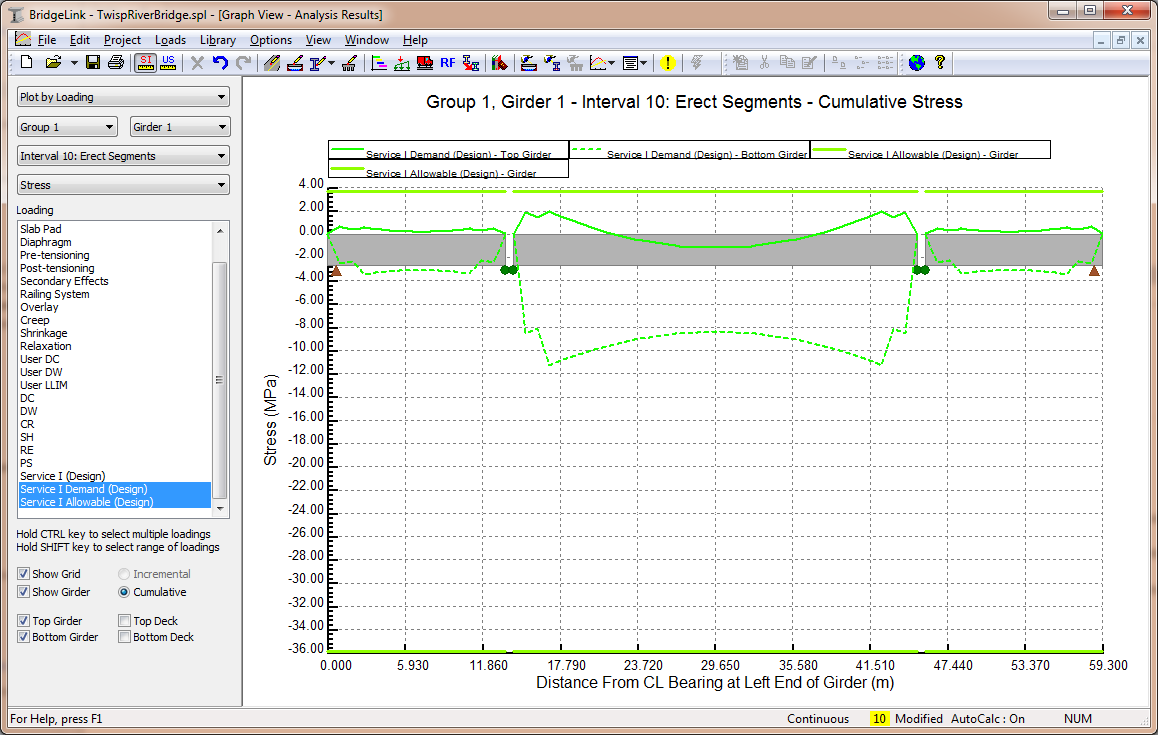
You can view a wide variety of graphical results. The most common results of interest are moments, shears, deflections, and stresses. You can also see graphical representations of girder properties, effective prestress, and more.
 1.8.11